
RESULTS
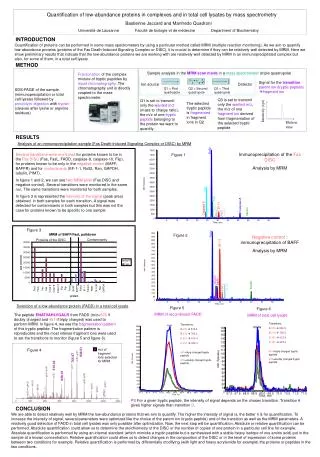
Sample analysis in the MRM scan mode in a mass spectrometer (triple quadrupole). Fractionation of the complex mixture of tryptic peptides by liquid chromatography . The chromatography unit is directly coupled to the mass spectrometer.

RESULTS
E N D
Presentation Transcript
Sample analysis in the MRM scan mode in a mass spectrometer (triple quadrupole) Fractionation of the complex mixture of tryptic peptides by liquid chromatography. The chromatography unit is directly coupled to the mass spectrometer. Signal for the transition parent ion (tryptic peptide) fragment ion Ion source Detector Q1 = First quadrupole Q2 = Second quadrupole Q3 = Third quadrupole SDS-PAGE of the sample (immunoprecipitation or total cell lysate) followed by proteolyticdigestion with trypsin (cleaves after lysine or arginine residues) Q3 is set to transmit only the wanted m/z, the m/z of one fragment ion derived from fragmentation of the selected tryptic peptide Q1 is set to transmit only the wanted m/z (mass to charge ratio), the m/z of one tryptic peptide belonging to the protein we want to quantify The selected tryptic peptide is fragmented in fragment ions in Q2 Intensity (cps) Elution time Quantification of low-abundance proteins in complexes and in total cell lysates by mass spectrometry Bastienne Jaccard and Manfredo Quadroni Université de Lausanne Faculté de biologie et de médecine Department of Biochemistry INTRODUCTION Quantification of proteins can be performed in some mass spectrometers by using a particular method called MRM (multiple reaction monitoring). As we aim to quantify low-abundance proteins (proteins of the Fas Death-Induced Signaling Complex or DISC), it is crucial to determine if they can be relatively well detected by MRM. Here we show preliminary results that indicate that the low-abundance proteins we are working with are relatively well detected by MRM in an immunoprecipitated complex but also, for some of them, in a total cell lysate. METHOD RESULTS Analysis of an immunoprecipitation sample (Fas Death-Induced Signaling Complex or DISC) by MRM Ro52 7500 Immunoprecipitation of the Fas DISC Analysis by MRM Several transitions were monitored for proteins known to be in the Fas DISC (Fas, FasL, FADD, caspase-8, caspase-10, Flip), for proteins known to be only in the negative control (BAFF, BAFFR) and for contaminants (EF-1-1, Ro52, Ran, GAPDH, tubulin, PIMT). In figure 1 and 2, we can see two MRM plots (Fas DISC and negative control). Several transitions were monitored in the same run. The same transitions were monitored for both samples. In figure 3 is represented the intensity of the signal (peak area) obtained in both samples for each transition. A signal was detected for contaminants in both samples but this was not the case for proteins known to be specific to one sample Figure 1 7000 6500 6000 5500 5000 4500 4000 Intensity, cps 3500 FasL 3000 2500 Fas 2000 Caspase-8 Ef-1-1 1500 Flip Caspase-8 1000 tubulin 14-3-3 PIMT 500 0 5 10 15 20 25 30 35 40 45 50 55 Time, min Figure 3 Ro52 950 Figure 2 MRM of BAFF/FasL pulldown Negative control : immunoprecipitation of BAFF Analysis by MRM 900 Contaminants Proteins of the DISC 850 Ef-1-1 40000 800 35000 750 700 30000 650 25000 600 BAFF 550 20000 cps (surface) FasL 500 Intensity, cps 15000 450 400 10000 350 5000 tubulin 300 BAFF 0 250 tubulin 14-3-3 200 PIMT Ef-1-1 Ran Ro52 GAPDH BAFFR 14-3-3b Flip Tubulin BAFF Flip PIMT Fadd FasL Casp-8 Casp-10 Fas FasL Casp-8 Fas 150 100 protein 50 0 5 10 15 20 25 30 35 40 45 50 55 Time, min Detection of a low-abundance protein (FADD) in a total cell lysate Figure 5 Figure 6 MRM of recombinant FADD The peptide ENATVAHLVGALRfrom FADD (m/z=676 if doubly charged and 451 if triply charged) was used to perform MRM. In figure 4, we see the fragmentation pattern of this tryptic peptide. The fragmentation pattern is reproducible and the most intense fragment ions were used to set the transitions to monitor (figure 5 and figure 6). MRM of total cell lysate Transitions A676 836.5 B676 765.5 C451 515.4 D451 628.4 451=triply charged tryptic peptide 676=doubly charged tryptic peptide Transitions A676 836.5 B 676 765.5 C451 515.4 D451 628.4 451=triply charged tryptic peptide 676=doubly charged tryptic peptide 68.04 68.69 3800 168 3600 160 3400 150 3200 140 3000 130 2800 120 2600 m/z of fragment ions selected for MRM Figure 4 110 836.51 2400 100 2200 765.47 90 2000 Intensity, cps Intensity, cps 1800 80 515.33 1600 70 1400 60 1200 50 628.41 1000 40 800 30 600 20 400 10 200 0 0 67.2 67.4 67.6 67.8 68.0 68.2 68.4 68.6 68.8 69.0 69.2 67.0 67.5 68.0 68.5 69.0 69.5 70.0 70.5 71.0 71.5 Time, min Time, min PS For a given tryptic peptide, the intensity of signal depends on the chosen transition. Transition A gives higher signals than transition D. CONCLUSION We are able to detect relatively well by MRM the low-abundance proteins that we aim to quantify. The higher the intensity of signal is, the better it is for quantification. To increase the intensity of signal, several parameters were optimized like the choice of the parent ion (tryptic peptide) and of the transition as well as the MRM parameters. A relatively good detection of FADD in total cell lysates was only possible after optimization. Now, the next step will be quantification. Absolute or relative quantification can be performed. Absolute quantification could allow us to determine the stoichiometry of the DISC or the number of copies of one protein in a particular cell line for example. Absolute quantification is performed by using an internal standard (which mimicks a tryptic peptide but is synthesized with a stable heavy isotope of one amino acid) put in the sample at a known concentration. Relative quantification could allow us to detect changes in the composition of the DISC or in the level of expression of some proteins between two conditions for example. Relative quantification is performed by differentially modifying (with light and heavy acrylamide for example) the proteins or peptides in the two conditions.


