Download
1 / 15
150 likes | 271 Views
Eric K. Zenner 1 , Martina L. Hobi 2 , Brigitte Commarmot 2 1 Penn State University, Univ. Park, PA, USA 2 Swiss Federal Institute for Forest, Snow and Landscape Research WSL Birmensdorf , CH, 19 June 2014.

E N D
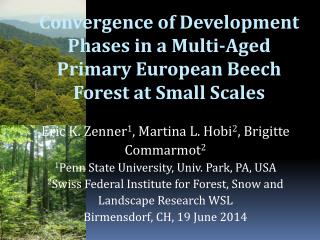
Eric K. Zenner1, Martina L. Hobi2, Brigitte Commarmot2 1Penn State University, Univ. Park, PA, USA 2Swiss Federal Institute for Forest, Snow and Landscape Research WSL Birmensdorf, CH, 19 June 2014 Convergence of Development Phases in a Multi-Aged Primary European Beech Forest at Small Scales
Development Stages and Phases (DS & P) • Long history of using DS & P in Europeanprimary/old-growth forests • Generally 3 stages (i.e., initial or growing up; optimal; decay or breaking down); often 3 phases nested in each stage • Stages correspond to the idea of biomass accumulation (sensu Bormann and Likens 1979)
Development Stages and Phases (DS & P) • Areas within forests characterized by differences in composition & structure that enable deduction about forest dynamics • # canopy stories, dbhdistn, volume, gaps…. • Multivariate differences among DS & P
Multi-aged Primary European Beech Forests • Small-scale disturbances (gap dynamics) • Mosaic of small-scale patches of different DS & P; intimate mixture of phases typical • Multi-aged and uneven-sized structures
Multi-aged Primary European Beech Forests • Despite the overall “appearance” of primary beech forests (e.g., negative exponential diameter distribution, gaps, large trees), the plenter phase (many- storied structure phase) is thought to be of limited extent and short duration • Is this due to the scales at which phases are typically distinguished?
Multi-aged Primeval European Beech Forest of Uholka • Located in the Ukrainian Carpathians • Part of UNESCO World Heritage site
Multi-aged Primeval European Beech Forest of Uholka • Largest primeval beech forest in Europe (>10,000 ha) • 10 ha monitoring plot est’d in 2000 (stem-mapped); >95% Eur. beech
Development Phases(adapted from Tabaku 2000) • CPA – crown projection area live • DS – prop. dead BA • NQD – normed quartile distance 100*(75th–25th)/ median • PSH – prop. stand ht
Methods • Fixed grid cells of increasing areas:
Results 2500 m2 156.25 m2 625 m2
Conclusions • Phase assignment appears strongly scale dependent • Proportion of the plenter-phase increased steadily with scale • At scales ≥625 m2, only the plenter, terminal, and decay phases (i.e., structurally most complex) remained not an unexpected result under gap dynamics!
Conclusions • Convergence to plenter-phase nearly complete at the scale of 1 ha • Results are in contrast to other studies that report limited spatial extent of plenter- phase maybe too fine scaled? Context? • Does it make sense to distinguish phases of very small extent? If so, to what end? • Is a gap = phase?