Download
1 / 23
230 likes | 379 Views
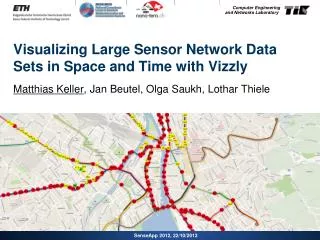
Visualizing Large Sensor Network Data Sets in Space and Time with Vizzly. Matthias Keller , Jan Beutel , Olga Saukh , Lothar Thiele. SenseApp 2012, 22/10/2012. GPS loggers. Coin-sized t emperature loggers. Low-power wireless sensor networks for permafrost monitoring.

E N D
Visualizing Large Sensor Network Data Sets in Space and Time with Vizzly Matthias Keller, Jan Beutel, Olga Saukh, Lothar Thiele SenseApp 2012, 22/10/2012
GPS loggers Coin-sized temperature loggers Low-power wireless sensor networksfor permafrost monitoring Mobile urban air quality sensing
More deployments, new sensors Four extra trams ~2,500 sensing channels 1stOpenSense tram 1st deployment 4th deployment New sensor: GPS 2nddeployment 3rd deployment
Visualizing All Signal Dynamics Interpolation of once loaded data Desired functionality Short-term behavior is not visible!
Research Questions and Challenges • Very large, multi-year data sets • How can we make all levels of detail accessible? • What are suited data structures for efficient data access? • How can we use precious resources, e.g., RAM, efficiently? • Unrestricted sensing modalities • Event-based or periodic sampling • (Mean) sampling rates can vary between seconds and days • System integration • Visualization service should fit into existing landscape
Overview • Related Work • Vizzly • System architecture • Location-preserving temporal aggregation • Hierarchical cache • Output generation • Case Study 1 2 3
Related Work • Data interfaces of other projects • SensorScope, GlacsWeb, da-sense, Geigermap, ... • Data streaming platforms, APIs • Pachube/Cosm, Google Fusion Tables, Microsoft SensorMap, … • Optimized database/data processing systems • RasDaMan, tsdb, sMAP, … • Evaluated solutions did not support (at least one): • the anticipated data volume • the visualization of multi-year time series in one view • the visualization of all signal dynamics
Overview • Related Work • Vizzly • System architecture • Location-preserving temporal aggregation • Hierarchical cache • Output generation • Case Study 1 2 3
Vizzly Overview Goal: Fast browsing of multi-year data at all levels of detail • Cache layer + web service + front-end library • Provides time series and map data widgets • Includes a management interface and health sensors • Freely available as open source software
System Architecture Users only need a web browser for interactively browsing through large data sets Aggregated data is stored in data structures that maintain temporal and spatial locality Processes, stores and publishes incoming data Recording of structured data with time and (optional) location information
Client-Server Communication Easy integration into arbitrary web pages User interface is only loaded once Vizzly servers returns (time, value) and (location, value) tuples, respectively, when requests parameters change How is the returned CSV data generated?
Back-end Design Challenges • Users can select data on temporal and spatial criteria • Arbitrary combinations of temporal and spatial aggregation levels cannot be cached efficiently • Location-preserving temporal aggregation scheme • Ideally, all data should also be ready in the Vizzly cache • Memory cache is the fastest, but also the smallest • Continuous updating of a hierarchical cache • Whenever possible, unaggregated data should be returned • Size of unaggregated data is not known beforehand • Sampling rate estimation
Location-preserving Temporal Aggregation Idea: Perform temporal aggregation before caching, but postpone spatial aggregation to request processing Down-sampling of time information to target resolution: 1 Aggregation function is applied to samples of equal down-sampled time and equal location information: 2 Resulting tuple is put into cache 3
Spatial Aggregation of Pre-Aggregated Data Spatial aggregation is only done when serving a concrete request Data of reduced temporal resolution is loaded from cache 4 Location information is reduced to matching target resolution: 5 Aggregation function is applied to samples of equal (reduced) time and location information: 6 Resulting tuples are sent to client 7
Back-end Design Challenges • Users can select data on temporal and spatial criteria • Arbitrary combinations of temporal and spatial aggregation levels cannot be cached efficiently • Location-preserving temporal aggregation scheme • Ideally, all data should also be ready in the Vizzly cache • Memory cache is the fastest, but also the smallest • Continuous updating of a hierarchical cache • Whenever possible, unaggregated data should be returned • Size of unaggregated data is not known beforehand • Sampling rate estimation
Hierarchical Cache Order of accesses until signal data is found Original data store DBMS, e.g., MySQL Memory fastest slowest
Memory Cache Idea: While time information can be linearized easily, doing so avoids searching for stored data and facilitates further down-sampling in the temporal domain Data without location information: Multiple entries for one timestamp Data with location information:
Cache Updating • Vizzly “learns” interesting signals from requests received • Learned signals are continuously polled for new data • Strategies for hierarchical caches • Balancing by signal popularity • Distribution by aggregation level • …
Back-end Design Challenges • Users can select data on temporal and spatial criteria • Arbitrary combinations of temporal and spatial aggregation levels cannot be cached efficiently • Location-preserving temporal aggregation scheme • Ideally, all data should also be ready in the Vizzly cache • Memory cache is the fastest, but also the smallest • Continuous updating of a hierarchical cache • Whenever possible, unaggregated data should be returned • Size of unaggregated data is not known beforehand • Sampling rate estimation
Request Processing in the Back-end Output generation for single view containing (n+m) signals: • For each signal, decide if unaggregated data points can be displayed (estimated mean sampling rate x time period) • Apply spatial filtering/aggregation when data with location information is loaded
Overview • Related Work • Vizzly • System architecture • Location-preserving temporal aggregation • Hierarchical cache • Output generation • Case Study 1 2 3
Data Fetch Performance • GSN: Unaggregated input • 2,100 sensing channels, ~550 million data points • MySQL DB: 1st aggregation level, 4 minutes resolution • 300 million aggregated data points, ~15 GB data • Memory: 2nd aggregation level, 16 minutes resolution • 100 million aggregated data points, ~800 MB data • 99th percentiles: • Live agg.: 4 msec • Memory: 5 msec • MySQL: 690 msec • GSN: 6.9 sec
Conclusions • New middleware for the interactive browsing of large sensor network data sets • Provided time series and map data widgets can be easily integrated into existing web pages • Data fetch are dramatically reduced by caching • Vizzly has proven its usefulness in more than 1 year of operation in a production environment • Vizzly is available as open-source software Demo: http://data.permasense.ch/ Project home: https://code.google.com/p/vizzly/