Download
1 / 29
290 likes | 298 Views
SADA is a Windows-based freeware that integrates scientific models with decision and cost analysis frameworks. It offers custom analysis, MARSSIM module, area of concern frameworks, cost benefit analysis, sampling designs, visualization/GIS, statistical analysis, and more.

E N D
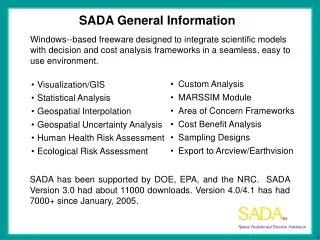
SADA General Information Windows--based freeware designed to integrate scientific models with decision and cost analysis frameworks in a seamless, easy to use environment. • Custom Analysis • MARSSIM Module • Area of Concern Frameworks • Cost Benefit Analysis • Sampling Designs • Export to Arcview/Earthvision • Visualization/GIS • Statistical Analysis • Geospatial Interpolation • Geospatial Uncertainty Analysis • Human Health Risk Assessment • Ecological Risk Assessment SADA has been supported by DOE, EPA, and the NRC. SADA Version 3.0 had about 11000 downloads. Version 4.0/4.1 has had 7000+ since January, 2005.
SADA General Information (cont.) Free stand-alone package for Windows 98, 98SE, NT SP4 or higher, 2000, ME, and XP. Contact information, updates, documentation, and downloads are available on-line at http://www.tiem.utk.edu/~sada/ A SADA user’s group, email, annual conferences, and 3-4 training sessions performed a few times a year. A substantial help file is included. Conduct “black and white box” testing internally as well as an external beta release period. Verification/quality assurance documents on the website. Strong international presence (over 50% of downloads outside USA)
Comprehensive Help File • 14 MB help file • Close to 400 different help file topics • Number of external links for benchmark sources, etc. • Help file topics online: • http://www.tiem.utk.edu/~sada/helpv4/ • Context-sensitive help on all forms and functions in SADA (press F1 or Help button)
SADA Users Guide • 320 page user guide available from: • http://www.tiem.utk.edu/~sada/SADA_4_1_Usersguide.pdf
Educational Use of SADA • SADA used by many universities in computer laboratories for teaching undergraduate environmental sciences courses • Actively creating curriculum for use by instructors for teaching both GIS and environmental assessment concepts • Developing an education resource web site for SADA: • http://www.tiem.utk.edu/~sada/education/
What exactly can you do in SADA? Create initial sample designs Import data Plot data Import GIS layers Aggregate sections of the site Calculate statistics (univariate) Model spatial correlation Create contour maps Create a kriging variance map Perform traditional HH and Eco risk assessments (tabular risk, screens, prgs, benchmarks) Create a HH or Eco contoured risk map Create a HH or Eco point risk map Create a data screen map for HH, Eco, Custom Create an eco point dose map Create an contoured eco dose map Create probability maps Define areas of concern Calculate cost vs cleanup Draw a LISA Map Develop secondary sample designs Perform a MARSSIM data analysis Detect and Define MARSSIM elevated area Visualize results in 3d Autodocument results Create a geobayesian site conceptual model Draw area of concern maps based on conceptual model Calculate cost vs cleanup based on conceptual model Update the site conceptual model Export to ESRI or Earthvision or common window applications
Sample Designs SADA has a number of sample design strategies in Version 4. These strategies include initial and secondary designs. Some are based on data alone while others are based on modeling results. With the exception of a couple of exclusively 2d designs all are available in 3d dimensions. Below are a few examples of each. Initial Designs Secondary Designs Systematic, unaligned, & hotspot search grids Adaptive Fill Random High Value Judgmental AOC Boundary
Data Formats • SADA can accept data in two formats: comma delimited files (csv) and Microsoft Access. • SADA requires the presence of certain fields in the data set. • Easting • Northing • Depth • Value • Name • SADA can use other forms of information as well • Media • Detection • Date • CAS Number • Any other form of meta data can be imported as well. User can plot and retrieve this meta data during an analysis. • SADA recognizes soil, sediment, surfacewater, groundwater, air, biota, and background, and the “basic” media type. Basic is assigned to data that have no media type.
Data Name Box Analysis Box Data Type Box Labels Box Layers Box Interviews Parameters Window Results Window Steps Window The SADA Interface: Scaleable Interfacing
Data Exploration Data Plot/GIS Overlays Spatial Data Screens Polygon Selection/Cutaways Statistics
Statistics • Numerous univariate statistics • Non-parametric hypothesis testing • Power curve based sample sizes • Histogram and cdf
Search Neighborhood Unsampled Point Spatial Interpolation The estimated value Vo at an unsampled location is estimated as the weighted average of nearby values.
Spatial Analysis Spatial Uncertainty Spatial Estimation
Geospatial References • Applied Geostatistics, Isaaks and Srivastava • Geostatistical Software Library (GSLIB), Deutsch and Journel • Geostatistics for Natural Resources Evaluation, Pierre Goovaerts • Geostatistics in Five Easy Lessons, Journel • Spatial Data, Cressie
Spatial Implementation of Risk Assessment • Conventional Risk Assessment Limitations • Typically regulatory exposure assessment guidance recommends a summary statistic for the exposure concentration • Spatial information is lost when a summary statistic is used in the RA- exposure is assumed to be continuous in space and time • Often this lost info not recovered in the rest of the remediation process • Reasons for incorporating spatial statistics into risk assessment • Maximize the use of limited resources • Efficiently collect data • Retain collected spatial info in the risk assessment • Use all types of available data, including expert judgment • To more adequately characterize the exposure distribution • Extrapolate from known data to cover data gaps • Account for spatial processes related to exposure • Better understand uncertainties in the exposure assessment
Ecological and Human Health Risk • SADA implements EPA methods for conducting ecological and human health risk assessments • Calculation of site-specific preliminary remediation goals • Benchmark database for contaminant effects on ecological receptors • Exposure modeling for humans and over 20 other terrestrial species • Contains IRIS/HEAST toxicity databases for calculating risk from exposure • Contains EPA default exposure parameters for the risk models • Tabular screening and risk results • Point screens • Risk and dose mapping
Human Health Risk Calculations • For each media • Soil, Sediment, Surface Water, Groundwater • Exposure Scenarios • Residential, Industrial, Recreational, Agricultural, Excavation • Exposure Pathways • Ingestion, Inhalation, Dermal Contact, Food Chain (Beef, Milk, and Vegetable Ingestion) • IRIS and HEAST Toxicity Databases for Carcinogenic and Noncarcinogenic Effects • Physical Parameters for Modeling • Bioaccumulation Factors • Volatilization, Particulate Emission Factors • Permeability Constants, Absorption Factors • Saturation Coefficients, Radionuclide Half-Lives
Human Health Risk Forward Risk PRG Calculation PRG Screens Risk Based Spatial Screens Risk Mapping Residential, Industrial, Agricultural, Recreational, Worker Ingestion, Inhalation, Dermal, External, Food Chain Soil, Sediment, Surfacewater, Groundwater Packaged with Editable Scenario Parameters Packaged with IRIS and HEAST Database
Ecological Capabilities in SADA • SADA implements EPA methods for conducting ecological risk assessments • Benchmark database for contaminant effects on ecological receptors, tabular and histogram access • Exposure modeling for over 20 terrestrial species • Contains EPA default exposure parameters for the risk models where available • Tabular screening and risk result output • Sample by sample screens displayed on maps • Risk and dose mapping • Areas of Concern based on exceedances of ecological benchmarks or TRVs • Suggest additional sample locations based on uncertain areas of exceedance
Ecological Benchmark Screening Ecological Benchmarks • Suitable for screening ERAs • Compilation of ecological benchmarks for surface water, soil, sediment, and biota • Benchmarks a function of environmental variables where appropriate • Choice of statistics (max, percentile, UCL95, etc.) • Hierarchy of media-specific benchmarks for screening • Spatial and tabular display of ratios
Ecological Dose Exposures • SADA calculates dose (mg/kg BW d) from food ingestion, soil ingestion, dermal contact, and inhalation for terrestrial exposures • SSL, Female, Male, or Juvenile • Over 20 different species
Custom Criteria • View or Edit Criteria • Data Screens
Decision Analysis • Spatial Screens • Sampling Strategies • Spatial Risk • Area of Concern • Cost Benefit Cost Vs Risk Reduction
3D Visualization True 3d Views: Points, Blocks, and Isosurfaces
SADA Overview: Autodocumentation • Provides transparency in the modeling process and facilitates reproducibility of results. • Self-documentation of all parameters, models, and other relevant information (e.g. exposure concentrations, risk models, exposure variables, geospatial parameters, toxicity data, images etc) AOC Map Report “Ingredients” (Based on HH, IDW, Block Design) (Word, WordPerfect, HTML)
Results Gallery • Users can now save “static” results to the results gallery • Users can view them, format them, and change various viewing properties • Prevents users from having to regenerate a picture each time they want to see it • Version 5.0 will allow dynamic results to be saved for further modeling
After viewing the links to additional resources, please complete our online feedback form. Thank You Links to Additional Resources