Download
1 / 27
270 likes | 380 Views
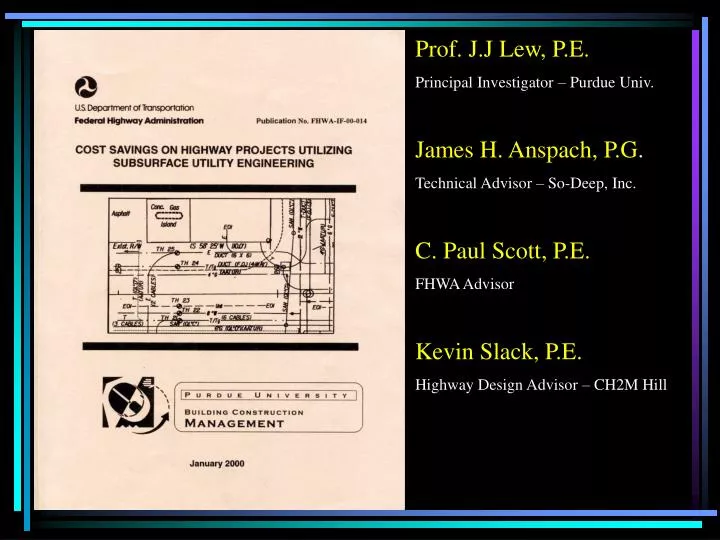
Prof. J.J Lew, P.E. Principal Investigator – Purdue Univ. James H. Anspach, P.G . Technical Advisor – So-Deep, Inc. C. Paul Scott, P.E. FHWA Advisor Kevin Slack, P.E. Highway Design Advisor – CH2M Hill.

E N D
Prof. J.J Lew, P.E. Principal Investigator – Purdue Univ. James H. Anspach, P.G. Technical Advisor – So-Deep, Inc. C. Paul Scott, P.E. FHWA Advisor Kevin Slack, P.E. Highway Design Advisor – CH2M Hill
The Federal Highway Administration (FHWA) commissioned Purdue University to study the effectiveness of subsurface utility engineering (SUE) as a means of reducing costs and delays on highway projects. Previous studies and statements of cost savings were performed by various state DOTs, providers of SUE services, and the FHWA. Commissioning Purdue University to conduct this study allowed for an independent and impartial review and study of costs savings.
Four States were selected to participate • Virginia • North Carolina • Ohio • Texas
Virginia DOT • Advantage • Oldest program – started in 1986 • Most comprehensive use of SUE mapping in the country – every state DOT project gets QL B and QL A mapping • Disadvantage • No recent database of claims / change orders due to not using QLB / QLA mapping
North Carolina DOT • Advantage • Program in development – used for approx 6 years • Many projects to choose from • Some system in place to track utility change orders / claims during construction • Disadvantage • At that time, did not use QL A mapping, only QL B • Mostly used on urban / suburban projects; few rural ones • Designers typically got data late in their design process, so not used as effectively as possible
OHIO DOT • Advantage • Program in development – used for approx 4 years • Aggressive program administrator kept track of past and present utility change orders / claims during construction • Used both QL B and QL A mapping • Disadvantage • Only used in several Districts – suburban in nature
TEXAS DOT • Advantage • New Program – used for only 2 years • Recent history of past and present utility change orders / claims during construction • Used both QL B and QL A mapping • All types of projects • Disadvantage • Most projects not yet in construction
General Investigative Procedure • Pick projects as randomly as possible • Interview DOT personnel, SUE consultants, utility owners, contractors, and designers • Review state-wide utility claims histories • Review project plans / utility records in detail
General Investigative Problems • Utility / DOT / Contractor personnel missing in action, retired, or unable to remember specifics • State DOT’s records of claims / change order history poor – usually worked out in “barter” by construction engineers or “hidden” in unrelated cost categories
Developed checklist of 21 areas for potential project savings • Did not differentiate between savings to utility owner versus DOT
Areas for Savings Reduction in unforeseen utility conflicts and relocations; Reduction in project delays due to utility relocates; Reduction in claims and change orders Reduction in delays due to utility cuts; Reduction in project contingency fees; Lower project bids; Reduction in costs caused by conflict redesign; Reduction in the cost of project design; Reduction in travel delays during construction to the motoring public; Improvement in contractor productivity and quality; Reduction in utility companies’ cost to repair damaged facilities;
Areas for Savings Minimization of utility customers’ loss of service; Minimization of damage to existing pavements; Minimization of traffic disruption, increasing DOT public credibility; Improvement in working relationships between DOT and utilities; Increased efficiency of surveying activities by elimination of duplicate surveys; Facilitation of electronic mapping accuracy; Minimization of the chance of environmental damage; Inducement of savings in risk management and insurance; Introduction of the concept of a comprehensive SUE process; Reduction in Right-of-Way acquisition costs.
The reductions in risk for projects utilizing SUE have been difficult to quantify. There are many variables and scenarios that may occur. Historical data is difficult to come by. Some savings are easily quantified; others may be qualitative or speculative in nature. This study categorizes savings accordingly. These types of costs are:
Exact costs that can be quantified in a precise manner. Examples are costs much like the costs for test holes, the cost to eliminate construction and utility conflicts, or any other cost for which exact figures can be obtained.
Estimated costs that are difficult to quantify, but can be calculated with a high degree of certainty. These costs were estimated by studying projects in detail, interviewing the personnel involved in the project, and applying historical cost data.
Costs that cannot be estimated with any degree of certainty due to a lack of data. These are true qualitative costs and may in fact be significant to the real cost savings. These qualitative costs are not quantified in the evaluation study. It is believed that the majority of savings fall into this category
Therefore, the cost savings reflected from this study are a MINIMUM QUANTIFIABLE SAVINGS True project savings are likely to be significantly higher than this study can prove.
Study Results - Virginia • Studied 9 projects – total construction value of $42M • Costs savings of QL B / QL A mapping over QL D /QL C mapping was a minimum of 412% • project delivery time savings of 12 percent-15 percent • Quality level B mapping identifies an average of 10 percent - 50 percent more utilities than traditional mapping (QL D and QL C).
Study Results – North Carolina • Studied 21 projects – total construction value of $205M • Costs savings of QL B mapping over QL D /QL C mapping was a minimum of 663% • SUE budget is approximately 2 % of the total stateDOT budget for eng/ construction/ • The majority of projects utilizing SUE showed no delays due to utility conflicts, an improvement over past data.
Study Results – Ohio • Studied 14 projects – total construction value of $284M • Costs savings of QL B / QL A mapping over QL D /QL C mapping was a minimum of 521% • SUE was initially used to solve field utility conflict questions /Could be more effective if used earlier in design
Study Results – Texas • Studied 28 projects – total construction value of $606M • Costs savings of QL B / QL A mapping over QL D /QL C mapping was a minimum of 427% • Projects only used on Interstate projects. Urban municipal projects not evaluated, but savings on these types of projects should be even more.
From a study of 71 projects with a combined construction value in excess of $1 billion, the results indicated the effectiveness of the study was a total of $4.62 in savings for every $1.00 spent on SUE. The costs of obtaining QL B and QL A (except NCDOT) data on these 71 projects were 0.5 percent of the total construction costs, resulting in a construction savings of 1.9 percent by using SUE. Qualitative savings were non-measurable, but it is clear that those savings are also significant and may be many times more valuable than the quantifiable savings.
Only three of 71 projects had a negative return on investment One individual project had a $206.00 to $1.00 return on investment (NCDOT).
This leads to the conclusion that SUE should be used in a systemic manner, i.e. on virtually every project Using the data from this study and given a national expenditure in 1998 of $51 billion for highway construction, the use of SUE in a systemic manner should result in a minimum national savings of approximately $1 billion per year.
QL B / QL A mapping budgets should be approximately 1% of state DOT Eng/Constr Budget This study shows a potential minimum stretching of project dollars by 4.62% if comprehensive QL B / QL A mapping is performed correctly.
State DOTs and their consultants should integrate this SUE mapping with the pending ASCE / ANSI Standard Standard Guidelines for the Collection and Depiction of Existing Subsurface Utility Data Antic. Publish date - 2002