Download
1 / 23
230 likes | 371 Views
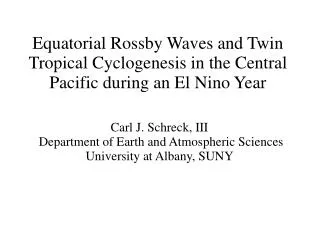
Carl J. Schreck, III Department of Earth and Atmospheric Sciences University at Albany, SUNY. Equatorial Rossby Waves and Twin Tropical Cyclogenesis in the Central Pacific during an El Nino Year. Introduction.

E N D
Carl J. Schreck, III Department of Earth and Atmospheric Sciences University at Albany, SUNY Equatorial Rossby Waves and Twin Tropical Cyclogenesis in the Central Pacific during an El Nino Year
Introduction • This study investigates Equatorial Rossby (ER) wave activity in the Central Pacific during the September-December 1997, the peak of a very strong El Nino. • These waves appear to be associated with four events of twin tropical cyclogenesis. • The waves are examined using two filters: • 15-40 day band pass time filtering • n=1 ER band space-time filter, as in Wheeler & Kiladis (1999)
Unfiltered relative vorticity, OLR, and winds for 970928/0000. Relative vorticity greater than 1.5x10⁻⁵ s-1 is contoured in red and relative vorticity less than -1.5x10⁻⁵ s-1 is contoured in blue, both in 1.5x10⁻⁵ s-1 intervals. OLR less than 210 W m-2 is shaded in intervals of 30 W m-2.
Unfiltered relative vorticity, OLR, and winds for 970930/0000. Relative vorticity greater than 1.5x10⁻⁵ s-1 is contoured in red and relative vorticity less than -1.5x10⁻⁵ s-1 is contoured in blue, both in 1.5x10⁻⁵ s-1 intervals. OLR less than 210 W m-2 is shaded in intervals of 30 W m-2.
Unfiltered relative vorticity, OLR, and winds for 971002/0000. Relative vorticity greater than 1.5x10⁻⁵ s-1 is contoured in red and relative vorticity less than -1.5x10⁻⁵ s-1 is contoured in blue, both in 1.5x10⁻⁵ s-1 intervals. OLR less than 210 W m-2 is shaded in intervals of 30 W m-2.
Unfiltered relative vorticity, OLR, and winds for 971004/0000. Relative vorticity greater than 1.5x10⁻⁵ s-1 is contoured in red and relative vorticity less than -1.5x10⁻⁵ s-1 is contoured in blue, both in 1.5x10⁻⁵ s-1 intervals. OLR less than 210 W m-2 is shaded in intervals of 30 W m-2.
Unfiltered relative vorticity, OLR, and winds for 971006/0000. Relative vorticity greater than 1.5x10⁻⁵ s-1 is contoured in red and relative vorticity less than -1.5x10⁻⁵ s-1 is contoured in blue, both in 1.5x10⁻⁵ s-1 intervals. OLR less than 210 W m-2 is shaded in intervals of 30 W m-2.
Unfiltered relative vorticity, OLR, and winds for 971008/0000. Relative vorticity greater than 1.5x10⁻⁵ s-1 is contoured in red and relative vorticity less than -1.5x10⁻⁵ s-1 is contoured in blue, both in 1.5x10⁻⁵ s-1 intervals. OLR less than 210 W m-2 is shaded in intervals of 30 W m-2.
Unfiltered relative vorticity, OLR, and winds for 971010/0000. Relative vorticity greater than 1.5x10⁻⁵ s-1 is contoured in red and relative vorticity less than -1.5x10⁻⁵ s-1 is contoured in blue, both in 1.5x10⁻⁵ s-1 intervals. OLR less than 210 W m-2 is shaded in intervals of 30 W m-2.
Unfiltered relative vorticity, OLR, and winds for 971012/0000. Relative vorticity greater than 1.5x10⁻⁵ s-1 is contoured in red and relative vorticity less than -1.5x10⁻⁵ s-1 is contoured in blue, both in 1.5x10⁻⁵ s-1 intervals. OLR less than 210 W m-2 is shaded in intervals of 30 W m-2.
Unfiltered relative vorticity, OLR, and winds for 971014/0000. Relative vorticity greater than 1.5x10⁻⁵ s-1 is contoured in red and relative vorticity less than -1.5x10⁻⁵ s-1 is contoured in blue, both in 1.5x10⁻⁵ s-1 intervals. OLR less than 210 W m-2 is shaded in intervals of 30 W m-2.
Summary of Synoptic Evolution • A strip of cyclonic vorticity forms on each side of the equator, associated with a westerly wind burst and convection in each hemisphere. • This structure propagates westward and may resemble an ER wave, although the convection is not in the same place as the shallow water model convergence. • Three tropical cyclones form in association with this wave. • As these tropical cyclones intensify and move poleward, the ER wave signature disappears.
Hovmoeller plot of unfiltered 850 hPa zonal wind component, averaged over 5°S-5°N, and unfiltered OLR, averaged over 10°S-10°N, overlaid with tropical cyclogenesis locations for events that occurred 15°S-15°N. Winds are contoured every 3 m s-1, with positive contours in red and negative contours in blue. OLR less than 210 W m-2 is shaded in 30 W m-2 intervals. Filled in hurricane symbols represent northern hemisphere cyclogenesis events and open hurricane symbols represent southern hemisphere cyclogenesis events. Green ellipses denote twin cyclone events.
Hovmoeller plot of band-pass 15-40 day 850 hPa zonal wind component, averaged over 5°S-5°N, and band-pass 15-40 day OLR, averaged over 10°S-10°N, overlaid with tropical cyclogenesis locations for events that occurred 15°S-15°N. Winds are contoured every 1 m s-1, with positive contours in red and negative contours in blue. OLR less than -10 W m-2 is shaded in warm colors and OLR greater than 10 W m-2 is shaded in cool colors, both in 10 W m-2 intervals. Filled in hurricane symbols represent northern hemisphere cyclogenesis events and open hurricane symbols represent southern hemisphere cyclogenesis events.
Hovmoeller plot of ER band-filtered 850 hPa zonal wind component, averaged over 5°S-5°N, and OLR, averaged over 10°S-10°N, overlaid with tropical cyclogenesis locations for events that occurred 15°S-15°N. Filtering is done following Wheeler and Kiladis (1999), omitting symmetry constraints. Winds are contoured every 1 m s-1, with positive contours in red and negative contours in blue. OLR less than -5 W m-2 is shaded in warm colors and OLR greater than 5 W m-2 is shaded in cool colors, both in 5 W m-2 intervals. Filled in hurricane symbols represent northern hemisphere cyclogenesis events and open hurricane symbols represent southern hemisphere cyclogenesis events.
Summary of Hovmoeller Plots • 15-40 day band-pass filtering makes the waves more pronounced, but a lot of structure remains. • Using the ER band-filter from Wheeler and Kiladis (1999) significantly clarifies the waves, but results in much lower amplitude. • The time filtered waves are slower and shorter than the space-time filtered waves. However, both have a period of 20-days. Both are consistent with the idealized shallow water solutions.
Unfiltered relative vorticity, OLR, and winds for 971004/0000. Relative vorticity greater than 1.5x10⁻⁵ s-1 is contoured in red and relative vorticity less than -1.5x10⁻⁵ s-1 is contoured in blue, both in 1.5x10⁻⁵ s-1 intervals. OLR less than 210 W m-2 is shaded in intervals of 30 W m-2.
Band-pass 15-40 day relative vorticity, OLR, and winds for 971004/0000. Relative vorticity greater than 0.5x10⁻⁵ s-1 is contoured in red and relative vorticity less than -0.5x10⁻⁵ s-1 is contoured in blue, both in 0.5x10⁻⁵ s-1 intervals. OLR less than -10 W m-2 is shaded in warm colors and OLR greater than 10 W m-2 is shaded in cool colors, both in intervals of 10 W m-2.
ER band-filter relative vorticity, OLR, and winds for 971004/0000. Relative vorticity greater than 0.2x10⁻⁵ s-1 is contoured in red and relative vorticity less than -0.2x10⁻⁵ s-1 is contoured in blue, both in 0.2x10⁻⁵ s-1 intervals. OLR less than -5 W m-2 is shaded in warm colors and OLR greater than 5 W m-2 is shaded in cool colors, both in intervals of 5 W m-2.
ER band-filter relative vorticity, OLR, and winds for 971004/0000. Relative vorticity greater than 0.2x10⁻⁵ s-1 is contoured in red and relative vorticity less than -0.2x10⁻⁵ s-1 is contoured in blue, both in 0.2x10⁻⁵ s-1 intervals. OLR less than -5 W m-2 is shaded in warm colors and OLR greater than 5 W m-2 is shaded in cool colors, both in intervals of 5 W m-2.
Summary of Synoptic Maps • An ER wave signature is apparent in the unfiltered, time-filtered, space-time filtered, and symmetric space-time filtered data. • While the convection is not in the same place as the convergence in the idealized shallow water solution, there still seems to be a coherent structure in both OLR and winds. • Each level of filtering smooths the structure and more closely resembles the idealized ER wave solution.
Conclusions • Equatorial Rossby wave activity is identified in unfiltered data during an El Nino year. • These waves appear to be associated with twin tropical cyclogenesis in the Central Pacific. • While the period stays the same, the time-filtered waves are shorter and slower than when they are space-time filtered. • With each level of filtering, the structure is smoothed and looks more like the idealized ER wave solution, though some structure is lost.