Download
1 / 18
180 likes | 382 Views
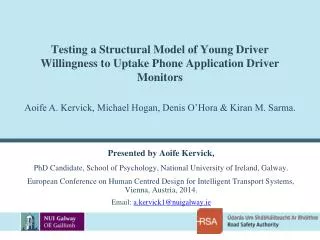
Testing a Structural Model of Young Driver Willingness to Uptake Phone Application Driver Monitors. Aoife A. Kervick, Michael Hogan, Denis O’Hora & Kiran M. Sarma. Presented by Aoife Kervick, PhD Candidate, School of Psychology, National University of Ireland, Galway.

E N D
Testing a Structural Model of Young Driver Willingness to Uptake Phone Application Driver Monitors Aoife A. Kervick, Michael Hogan, Denis O’Hora & Kiran M. Sarma. Presented by Aoife Kervick, PhD Candidate, School of Psychology, National University of Ireland, Galway. European Conference on Human Centred Design for Intelligent Transport Systems, Vienna, Austria, 2014. Email: a.kervick1@nuigalway.ie
In-Vehicle Monitoring Acceptance In-vehicle data recorders and PADMs show great promise in moderating young driver risk-taking (e.g. Carney et al., 2010; Simons-Morton et al., 2013). Technology acceptance is crucial in the context of voluntary usage. Research has revealed predominantly negative young driver attitudes towards monitor use however (e.g. Lerner et al., 2010; Young et al., 2003). Studies also typically require substantial financial incentives to recruit participants, and have reported incidences of device sabotage (e.g. Lahrmann et al., 2012; McCartt et al., 2010; Young et al., 2010).
Technology Acceptance Literature There are a multitude of existing TA models, theories and definitions; e.g. TRA (Fishbein & Ajzen, 1975), TPB (Azjen, 1985), TAM (Davis, 1989), UTAUT (Venkatesh et al., 2003) etc. Any young driver, monitoring technology ‘willingness to use’ research has typically been qualitative however, and not model focused (e.g. Guttman & Gesser-Edelsburg, 2011) . Context specific acceptance models are necessary (e.g. Kaasinen et al., 2011).
Method : Procedure • 2 young driver focus groups • Online survey generated • Social media campaign • One week follow-up
Method : Participant Sample(n = 333) • Participants were primarily female (66%, n = 220). • A mean age of 21.38 years (SD = 1.77)was reported. • The majority were students (68% UG, 18% PG, 1% 2ndlevel). 11% were employed, and 2% were unemployed. • Driving experience ranged from <1 to 7 years, with a mean of 2.5 (SD = 1.80). 14%
PADM Specific Technology Adoption Model Figure 1.1 PADM Adoption Model
Results III : Structural Equation Modeling Table 1.2 Fit Statistics of Original and Revised Versions of the PADM Structural Model
Structural Model Figure 1.2 PADM Model Path Output
Structural Model : Direct Effects on BI .526*** .363*** -.008 .073 Figure 1.3 Direct Effects on BI
Direct Effects on Willingness to Uptake (BI) Table 1.3 Standardised and unstandardized regression weights (with standard errors) for the structural equation model of PADM acceptance.
Indirect Effects and Multi-Group Analyses • Two significant indirect effects on BI emerged from analyses: Social Influence Perceived Gains BI β = .249, B = .387, SE = .046, CI = 0.175 -.327, p = .001 Perceived Risks Perceived Gains BI β = -.094 , B = -.147, SE =.034 , CI = -.161--.046, p = .001 • Multi-group analyses were also conducted. The structural model functioned equivalently for the three groups as indicated by ∆ CFI scores <.01, and non-significance of the x2 difference test(Byrne, 2010).
Results IV : Adoption • There were a number of issues with our adoption measure, and preliminary logistic regression analyses indicated that this resulted in misclassifications for the adoption group. • We conducted nonparametric t-tests to identify any significant differences between the adopting (n=30), and non-adopting (n=303) participants. Behavioural intention differed significantly for adopters (Mdn = 17) versus non-adopters (Mdn = 16), U = 3398, z = -2.33, p = .02, r = -.128. Usability differed significantly significantly for adopters (Mdn = 8), and non-adopters (Mdn = 7), U = 3195, z = -2.73, p =.006 , r = -.149.
Discussion The measurement and structural model reported ‘excellent’ fit and multi-group invariance (Byrne, 2010; Hooper et al., 2008). ‘Perceived Gains’ and ‘Social Influence’ were significant direct predictors of ‘Behavioural Intention’ (p < .05), highlighting the importance of these factors in young driver willingness to uptake PADMs. ‘Usability’ and ‘Perceived Risks’ were not found to predict intention to use, contrary to previous findings (see Venkatesh et al., 2003). Perceived Risks did have a significant indirect effect on intention as mediated by Perceived Gains however.
Discussion • Although the amount of variance in adoption accounted for by the model could not be calculated, it explained a considerable proportion of the variance in ‘Behavioural Intention’ (72.5%). This must be interpreted with caution however. • Interestingly, adopting and non-adopting participants differed significantly on Usability and Behavioural Intention, in line with TA and TPB literature findings (e.g. Gefen & Straub, 2000; see Venkatesh et al., 2003).
Limitations • This model needs be tested with a more representative national sample, e.g., the majority of participants were female, undergraduate students. • An improved measure of ‘adoption’ was needed. This may have resulted in higher, more accurate, uptake levels. • PADM functionality was merely described, and not experienced.
Conclusion • This model holds great promise in understanding young driver willingness to uptakePADMs. • Problematically low levels of ‘Adoption’ i.e. young drivers who clicked to download the PADM, were reported throughout however (9%). • Targeting driver perceptions relating to perceived gains, social influence and usability may prove an effective way of increasing future adoption rates.
Thank you for your attention. Any Questions? Or, contact me at: a.kervick1@nuigalway.ie