Download
1 / 37
370 likes | 530 Views
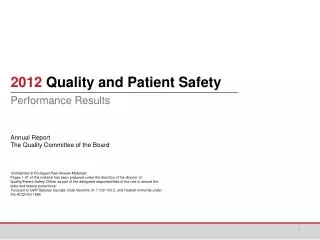
2012 Quality and Patient Safety Performance Results. Annual Report The Quality Committee of the Board Confidential & Privileged Peer Review Materials;

E N D
2012 Quality and Patient Safety Performance Results Annual Report The Quality Committee of the Board Confidential & Privileged Peer Review Materials; Pages 1-31 of this material has been prepared under the direction of the director of Quality/Patient Safety Officer as part of the delegated responsibilities of the role to ensure the state and federal protections: Pursuant to GPR Statutes Georgia Code Sections 31.7.130-133.3, and Federal Immunity under the HCQI Act 1986. 1
One is Too Many Harm from the Patient’s Point of View 3
Down Stream Impact: Affordable Care Act • CMS & Innovation Center (CMMI) • $1B to Partnership for Patient Safety (PfP) to Achieve 2 Goals 2013: • 1. Reduce HAC’s by 40% • 2. Reduce Re-admissions by 20% • State level - Healthcare Engagement Networks (HEN’s): • 26 HEN’s Across Country • GA HEN / Georgia Hospital Association: • Drive improvement of 10 HAC’s • Local Accountability for [Organization]: • Reduce Harm for ___ HAC’s • Demonstrate Best Practice • Influence policy • Report Data to CMS Pay for Performance 4
Understanding the Clinical Climate of 2012 • Patient Volume [amount of change]from 2011 to 2012. • Total Number of Patient Days [amount of change] from 2011 to 2012. • Administered doses of medication [amount of change] (__ for Inpatient and __ for Outpatient) from 2011 to 2012. 5
Patients with Underlying Conditions [Graph of Comorbiditites by Tier] Tier 0 Tier 1 Tier 2 Tier 3 Single Focused Injury Most complex secondary med mgmt Least complex secondary med mgmt 6
Approach Advancement of Safe and Reliable Care THROUGH: Adoption: Scientific Evidence Safe andReliable Care Mindful: Delivery of Care Engage: Patients and Families Standardize: High Risk Practice 7
* Worst, acceptable rates established by CMS: Effective 2013 **Mandated by CMS LTCH Quality Reporting Program: Effective October 2012
Central Line Associated Blood Stream Infections CLABSI #Patient Harms [note: Include 1 icon for each harm] 10
Central Line Associated Blood Stream Infections CLABSI Harm from the Patients Perspective • The Story of CLABSI Harm • [Story of patient Harm] • The Person • [Patient Profile] • The Impact/Temporary • [Impact of patient Harm] • The Discharge • [Patient’s discharge status] 11
Central Line Associated Blood Stream Infections CLABSI Definition: Rate based on the total number of inpatients with confirmed blood stream infection per 1,000 central line days, based on CDC definition Potential Cost of Harm: $45,000 / hospital stay2 • 2012 Performance: • [Summary] 2012 Rate: 2013 CMS Target: 0.48 / 1,000 device days [Control Chart of CLABSI Rate] 12
Catheter Associated Urinary Tract Infections CAUTI #Patient Harms [note: Include 1 icon for each harm] 13
Catheter Associated Urinary Tract Infections CAUTI Harm from the Patients Perspective • The Story of CAUTI Harm • [Story of patient Harm] • The Person • [Patient Profile] • The Impact/Temporary • [Impact of patient Harm] • The Discharge • [Patient’s discharge status] 14
Catheter Associated Urinary Tract Infections CAUTI Definition: Rate based on the number of patients with indwelling catheters who are symptomatic with confirmed infection per 1000 catheter days, based on CDC definition. Potential Cost of Harm: $44,043 / hospital stay8 • 2012 Performance: • [Summary] 2012 Rate: 2013 CMS Target: 0.48 / 1,000 catheter days [Control Chart of CAUTI Rate] 15
Ventilator Associated Pneumonia VAP ZEROPatient Harm ____ Years: based on the CDC definition + ____ Days : free from Harm ____ Patients: were kept free from Ventilator Harm 16
Ventilator Associated Pneumonia VAP Definition: Rate based on total number of inpatients with confirmed infection per 1,000 ventilator days. National Healthcare Safety Network's definition of VAP: patient on ventilator, physician diagnosis of pneumonia post admission based on diagnostic, imaging, and/or laboratory results. Potential Cost of Harm:$40,000 / hospital stay1 • 2012 Performance: • [Summary] 2012 Rate: 2013 CMS Target: 0.66 / 1,000 vent days [Control Chart of VAP Rate and Device Utilization] 17
#Patient Harm Falls with Harm [note: Include 1 icon for each harm] 18
Falls with Harm Harm from the Patients Perspective • The Story of Fall with Harm • [Story of patient Harm] • The Person • [Patient Profile] • The Impact/Temporary • [Impact of patient Harm] • The Discharge • [Patient’s discharge status] 19
Falls with Harm Definition: Figures are based on number of individual falls with harm reported through incident reports. The hybrid scale developed by Georgia Hospital Association (GHA) defines categories E - I as "with harm." The range is between temporary harm, prolonged hospitalization, permanent harm, near death and death. Potential Cost of Harm: Variable • 2012 Performance: • [Summary] 2012 Rate: 2013 CMS Target: 0.5 injury falls / 1,000 pt. days [Control Chart of Falls with Harm Rate] 20
Inpatient Fall Rate Definition: Individual inpatient falls are reported through incident reports capturing assisted and unassisted falls. Rate is number of falls per 1,000 pt days Potential Cost of Harm: Variable • 2012 Performance: • [Summary] 2012 Rate: 2013 CMS Target: 2.15 / 1,000 patient days [Control Chart of Assisted Falls Rate] [Control Chart of Unassisted Falls Rate] 21
Adverse Drug Events ADE #Patient Harms [note: Include 1 icon for each harm] 22
Adverse Drug Events ADE Harm from the Patients Perspective • The Story of ADE Harm • [Story of patient Harm] • The Person • [Patient Profile] • The Impact/Temporary • [Impact of patient Harm] • The Discharge • [Patient’s discharge status] 23
Adverse Drug Events ADE Definition: Harm is defined on a scale developed by Georgia Hospital Association, categories E - I (temporary Harm to Death). Figures based on number of individual medication incidents with harm as reported through incident reports. Potential Cost of Harm: Variable • 2012 Performance: • [Summary] 2012 Rate: 2013 CMS Target: 5% INR>5 & 7% BG<50 [Control Chart of ADE Rate] 24
Pressure Ulcers #Patient Harms [note: Include 1 icon for each harm] 25
Pressure Ulcers Harm from Patients Perspective • The Story of PU Harm • [Story of patient Harm] • The Person • [Patient Profile] • The Impact/Temporary • [Impact of patient Harm] • The Discharge • [Patient’s discharge status] 26
Pressure Ulcers Definition: Hospital Acquired Pressure Ulcers with Harm are Stage III and Stage IV pressure ulcers that developed while in the hospital. Potential Cost of Harm: $1,600 / day4 • 2012 Performance: • [Summary] 2012 Rate: 2013 CMS Target: 3.21 / 1,000 discharges [Control Chart of HA PU Rate] 27
Venous ThromboembolismVTE #Patient Harms [note: Include 1 icon for each harm] 28
Venous ThromboembolismVTE Harm from Patients Perspective • The Story of VTE Harm • [Story of patient Harm] • The Person • [Patient Profile] • The Impact/Temporary • [Impact of patient Harm] • The Discharge • [Patient’s discharge status] 29
Venous ThromboembolismVTE Definition: Any Patient with pulmonary embolism or deep vein thrombosis per 1,000 discharges Potential Cost of Harm: $19,000 (DVT) $37,000 (PE) • 2012 Performance: • [Summary] 2012 Rate: 2013 CMS Target: 5.6 cases/1,000 discharges [Control Chart of VTE Rate] 30
Preventable Readmissions #Patient Harms [note: Include 1 icon for each harm] 31
Preventable Readmissions Harm from Patients Perspective • The Story of Readmission Harm • [Story of patient Harm] • The Person • [Patient Profile] • The Impact/Temporary • [Impact of patient Harm] • The Discharge • [Patient’s discharge status] 32
Preventable Readmissions Definition: Definition: Unplanned all cause readmissions within 30 days - Medicare patients only Potential Cost of Harm: TBD • 2012 Performance: • [Summary] 2012 Rate: 2013 CMS Target: Reduce hospital baseline by 20% [Control Chart of Readmission Rate] 33
Organizational Responsiveness to Quality and Patient Safety Issues 34
Organizational Responsiveness to Quality and Patient Safety Issues + Significance: A significant adverse event, also known as a sentinel event, is an unexpected occurrence involving death or serious physical or psychological injury or the risk thereof and signals the need for immediate drill down and organizational response. The terms "sentinel" and "error" are not synonymous. Not all serious adverse (sentinel) events occur because of an error, and not all errors result in a serious adverse (sentinel) event. + Analysis: 35