Download
1 / 57
580 likes | 813 Views
NEURAL NETWORKS FOR TECHNICAL ANALYSIS: A STUDY ON KLCI. 授課教師:楊婉秀 報告人:李宗霖. Outline. Introduction Forecasting the Stock Market Neural Network and its Usage in the Stock Market A Case Study on the Forecasting of the KLCI Discussion Conclusion and Future Research. Introduction.

E N D
NEURAL NETWORKS FOR TECHNICAL ANALYSIS: A STUDY ON KLCI 授課教師:楊婉秀 報告人:李宗霖
Outline • Introduction • Forecasting the Stock Market • Neural Network and its Usage in the Stock Market • A Case Study on the Forecasting of the KLCI • Discussion • Conclusion and Future Research
Introduction • It is generally very difficult to forecast the movements of stock markets. • Artificial neural networkis a well-tested method forfinancial analysis on the stock market.
Introduction • Using neural networks in equitymarket applications include: • Forecasting the value of a stock index • Recognition of patterns in trading charts • Rating of corporate bonds • Estimationof the market price of options • Indication of trading signalsof selling and buying
Introduction • Feed-forward back propagation • Without the use of extensive market data or knowledge useful prediction can be made and significant paper profit can be achieved.
Forecasting the Stock Market • There are three schools of thought in terms of the ability to profit from the equity market. • Random Walk Hypothesis&Efficient Market Hypothesis • fundamental analysis • Technical analysis
Forecasting the Stock Market • Use a variety of techniques to obtain multiple signals. • Neural networks are often trained by both technical and fundamental indicators to produce trading signals.
Forecasting the Stock Market • For fundamental methods: • retail sales • gold prices • industrial production indices • foreign currency exchange rates • For technical methods: • delayed time series data • technical indicators
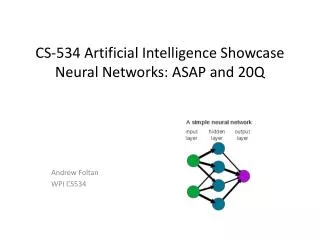
3.1 Neural networks • Neural networks
3.2 Time series forecasting with neural networks • Three major steps in the neural network based forecasting proposedin this research: • Preprocessing • Architecture • Postprocessing
3.3 Measurements of neural network training • Normalized Mean Squared Error (NMSE) • Signs • Gradients
3.3 Measurements of neural network training • We argue that NMSE may not be the case for tradingin the context of time series analysis.
A Case Study on the Forecasting of the KLCI • Kuala Lumpur Composite Index (KLCI) • Neural networks aretrained to approximate the market values. • To find the hidden relationship between technical indicators and future KLCI.
Data choice and pre-processing • The major types of indicators • moving average (MA) • momentum (M) • Relative Strength Index (RSI) • stochastics (%K) • moving average of stochastics (%D)
Data choice and pre-processing • inputs • It−1 • It • MA5 • MA10 • MA50 • RSI • M • %K • %D • output • It+1
Data choice and pre-processing • Normalization
Neural network model building • Historical data are divided into three parts • Training sets (2/3) • Validation sets (2/15) • Testing sets (3/15)
Neural network model building • A trade-offbetweenconvergence and generalization. • Numberof hidden nodes
Neural network model building • Primary sensitive analysis is conducted for input variables. • Low influencefactors: M20, M50, %K, %D • High influencefactors: It, RSI, M, MA5 • Chosen for input: It, MA5, MA10, RSI, M, It−1
Paper profits using neural network predictions • In a real situation, this might not be possible as some indexed stocks may not be traded at all on some days. • The transaction cost of a big fund trading, which will affect the market prices was not taken into consideration in the calculation of the “paper profit”.
Benchmark return comparison • Benchmark 1: • Benchmark 2:
Benchmark return comparison • Benchmark 3:
Comparison with ARIMA • Autoregressive Integrated Moving Average (ARIMA) Model • Introduced byGeorge Box and Gwilym Jenkins in 1976. • Provideda systematic procedure for the analysis of time series that was sufficientlygeneral to handle virtually all empirically observed time series data patterns. • ARIMA(p, d, q)
Discussion • A very small NMSE does not necessarily imply good generalization. • Bettertesting results are demonstrated in the period near the end ofthe training sets. • We have no data to test the “best” model. • There are two approaches for using the forecastingresult. • best-so-far approach • committee approach
Discussion • Measures • NMSE • Sign • Gradient • Fourchallenges • inputs andoutputs • types of neural networks and the activation functions • neural network architecture • evaluate thequality of trained neural networks for forecasting
Conclusion and Future Research • It shows that useful prediction could be made for KLCI without the use of extensivemarket data or knowledge. • It shows how a 26% annual return could be achieved by using the proposed model. • It highlights the following problems associated with neural network based timeseries forecasting: • the hit rate is a function of the time frame chosen for the testing sets; • generalizability of the model over time to other period is weak; • there should be some recency tradeoffs.
Conclusion and Future Research • A mixture of technical and fundamental factors as inputs over different time periods should be considered. • Sensitivity analysis should be conducted which can provide pointers to the refinement of neural network models. • The characteristics of emerging markets such as KLCI should be further researched to facilitate better modeling of the market using neural networks.
Forecasting the Stock Market • The research done here would be considered a violation of the above twohypotheses above for short-term trading advantages in, Kuala Lumpur StockExchange (KLSE for short hereafter)
Forecasting the Stock Market • There are three schools of thought in terms of the ability to profit from the equity market. • The first school believes that no investor can achieve above averagetrading advantages based on the historical and present information. • Random Walk Hypothesis • Efficient Market Hypothesis • Taylor provides compelling evidence to reject the randomwalk hypothesis and thus offers encouragement for research into better marketprediction.
Forecasting the Stock Market • The second school's view is the so-called fundamental analysis. • It looks indepth at the financial conditions and operating results of a specific companyand the underlying behavior of its common stock. • In 1995 US$1.2 trillion of foreign exchangeswapped hands on a typical day [10]. The number is roughly 50 times the value ofthe world trade in goods and services which should be the real fundamental factor.
Forecasting the Stock Market • Technical analysisbelongs to the third school of thought. • It attempts to use past stock price and volumeinformation to predict future price movements. • These five series are open price, close price, highestprice, lowest price and trading volume. • Most of the techniques used by technical analysts have not been shown to be statistically valid and many lack a rational explanation for their use