Download
1 / 1
10 likes | 90 Views
IBG-MSP is a bioinformatics tool to consolidate mass spectrometry databases, aiding in protein identification through database searching. The tool uses empirical data to match unknown protein spectra and supports MS/MS annotations. Utilizing fragmentation rules, it generates annotated theoretical spectra to aid accurate protein identification. Adopting industry standards and algorithms for CID, IBG-MSP stores metadata and supports training data for new analysis tools.

E N D
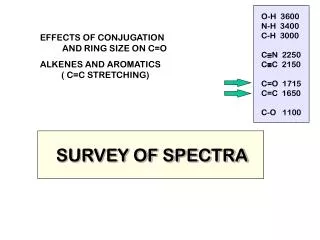
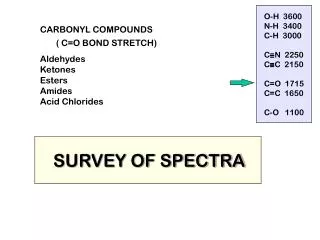
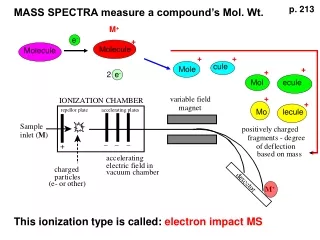
Fragmentation Modeling Tool Peptide Structure and Fragmentation Abstract Mass spectrometry has generated vast amounts of data and is the central technology in proteomics research. Presently, several databases containing empirically derived tandem mass spectrum (MS/MS) data are publicly available. These can be used singly or in a concatenated fashion; together they contain the sequences of more than 12 million proteins. We have imported these into the Illinois Bio-Grid Mass Spectrometry Proteomics Database (IBG-MSP) along with annotations. The aim is to consolidate these now scattered public databases into a central resource and to allow this database to be utilized for protein identification. Database searching is the most popular approach used to identify unknown proteins. Spectra of unknown proteins are matched against theoretical spectra derived from genomic or proteomic sequence databases. We have developed software to utilize our empirical database to match against these unknown protein spectra which allows for more accurate protein identification, especially in cases of post-translational modifications. Our IBG-MSP contains a plethora of metadata including the amino acid sequence and details on the experimental techniques utilized in collecting the samples. The overall format for the metadata closely follows mzXML, an industry standard supported by HUPO. The IBG-MSP also supports MS/MS annotations, where peaks may be annotated using terminology conventionally used in describing MS/MS fragment ion series. This is accomplished through the implementation of algorithms based on the fragmentation rules of Collisionally Induced Dissociation (CID) of protonated peptide ions. An annotated theoretical spectrum is generated from each amino acid sequence, and the masses in each theoretical spectrum are matched to those in each experimental spectrum. Those annotations are then stored in the database. As a centralized, computational solution for mass spectrometry-based proteomic analyses, the IBG-MSP will not only be utilized to identification of proteins, but to provide training data for development of new proteomic analysis tools. Sources of Imported Data Peptide Atlas [6] http://www.peptideatlas.org/repository Tranche @ ProteomeCommons.org [5] http://www.proteomecommons.org/data.jsp References IBG-MSP Database and the Data Loaded A Database of Peak Annotations of Empirically Derived Mass Spectra Dennis Harman[1], Patrick Smyth[2], and David Sigfredo Angulo[3] [1] DePaul University, CTI. d_harman60657@yahoo.com [3] DePaul University, CTI.dangulo@cti.depaul.edu [2]DePaul University, CTI.phsmyth@ameritech.net (to whom correspondence is to be addressed) The ER diagram shown displays the principal tables and their associated relations contained within the IBG-MSP database. The meta data from xml file sources (Accession id, machine type, precursor mass, etc..) is contained within the database. Researchers can perform searches on any data items. Annotations such as a, b, or c and x, y, or z ions, neutral loss or gain, immonium ion, or internal cleavage ion can be found in the following tables: ionSeriesDetail, neutrallosscharge, and internalclevageion. The Batch ImportModule is a Java program, which is hosted on a 20 node cluster and is used to download data from various publicly currated databases. The Module takes, as input, mass spectra, which are stored in mzXML files, and the peptide sequences (stored in xml or csv files) associated with the spectra. A Fragmentation Modeling Tool is utilized to annotate the spectra, as the data are imported into the database. The Module utilizes Java Beans, Java JAXB technology, and the ProteomeCommons IO Framework [5]. Peptide ions do not fragment at random, but instead they always fragment with a certain order, which is well understood. A Fragmentation Modeling Software Tool was implemented that can be used to predict the potential ions that could theoretically be produced given a specific amino acid sequence. The Tool implements the rules of the peptide fragmentation process and uses data structures that we had previously developed [2], [3]. Based on the amino acid sequence associated with the spectrum being imported, the Tool computes the theoretical peaks of ions containing the N terminus and the C terminus (see figure to the right). These theoretical peaks are then compared with the peaks in the imported spectrum using a linear time matching algorithm. Where a match is found, the annotation of the theoretical peak is used to annotate the actual peak in the imported spectrum. Fragmentation of peptides typically occurs along the peptide backbone. The terminology conventionally used in describing MS ions encapsulates information about the fragmentation processes that took place to produce the ions. Each residue in the peptide chain successively fragments off, both in the N- to-C and C-to-N directions. The location in the backbone where the fragmentation occurs and the terminus retaining the ionization charge result in the formation of various ion types, a, b, or c and x, y, or z ions. Doubly charged tryptic peptides mainly yield singly charged y- and b-ions. A loss of a CO group resulting in a mass difference of 27.9949 Da relative to the b-ion can also occur and form a-ions. Other ions due to losses of neutral H2O and NH3 are possible. [1] M. Kinter and N.E. Sherman, Protein Sequencing and Identification Using Tandem Mass Spectrometry, 2000; John Wiley & Sons, Inc, New York, NY. [2] Harman, D. and D. S. Angulo. Annotation of Mass Spectrum Data (Poster). Proceedings of the DePaul CTI Research Symposium. Chicago, IL. May 5, 2997 [3] Harman, D.; Angulo, D.; Drew, K; Schilling, A. A Data Model for Annotating the Peaks of Mass Spectrum Data (Poster). Proceedings of the Midwest Software Engineering Conference/DePaul CTI Research Symposium. Chicago, IL. April 29, 2006. [4] http://www.illinoisbiogrid.org/MSDB [5] http://www.proteomecommons.org/ [6] http://www.peptideatlas.org/repository