
IT, 3 분기 이익 가시성 가장 높은 업종
400%. 업종별 3 분기 영업이익 증가율 (YoY). 300%. 200%. 100%. 0%. -100%. -200%. 조선. 화학. 정유. 은행. 증권. 기계. 통신업. 자동차. 비정유. 유통업. 비금속. 건설업. 의약품. 반도체. 보험업. 음식료. 기타금융. 운수장비. 종이목재. 섬유의복. 전기전자. 비반도체. 철강금속. 전기가스. 운수창고. IT, 3 분기 이익 가시성 가장 높은 업종. 250%. 200%. 150%. 100%. 50%. 0%.

IT, 3 분기 이익 가시성 가장 높은 업종
E N D
Presentation Transcript
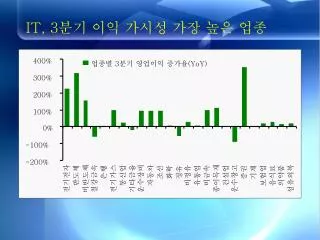
400% 업종별 3분기 영업이익 증가율(YoY) 300% 200% 100% 0% -100% -200% 조선 화학 정유 은행 증권 기계 통신업 자동차 비정유 유통업 비금속 건설업 의약품 반도체 보험업 음식료 기타금융 운수장비 종이목재 섬유의복 전기전자 비반도체 철강금속 전기가스 운수창고 IT, 3분기 이익 가시성 가장 높은 업종
250% 200% 150% 100% 50% 0% -50% -100% 조선 화학 정유 은행 증권 기계 통신업 자동차 비정유 유통업 건설업 의약품 반도체 보험업 음식료 운수장비 서비스업 섬유의복 전기가스 운수창고 전기전자 비반도체 철강금속 2009년 vs 2010년 영업이익 증가율
40% 투자는 경기하락기에 소비증가율 - 투자증가율 30% 빠르게 감소했지만 회복 속도도 느리다 20% 10% 0% -10% -20% -30% -40% 81 83 85 87 89 91 93 95 97 99 01 03 05 07 09 소비 증가율 vs 투자 증가율
40% 투자는 경기하락기에 소비증가율 - 투자증가율 30% 빠르게 감소했지만 회복 속도도 느리다 20% 10% 0% -10% -20% -30% -40% 81 83 85 87 89 91 93 95 97 99 01 03 05 07 09 소비 증가율 vs 투자 증가율
40% 투자는 경기하락기에 소비증가율 - 투자증가율 30% 빠르게 감소했지만 회복 속도도 느리다 20% 10% 0% -10% -20% -30% -40% 81 83 85 87 89 91 93 95 97 99 01 03 05 07 09 소비 증가율 vs 투자 증가율