Download
1 / 15
150 likes | 330 Views
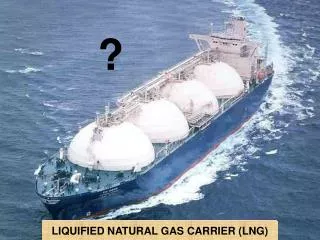
U.S. Natural Gas Storage and The Global LNG Market. James M. Kendell Energy Information Administration James.kendell@eia.doe.gov. LNG North American Summit 2008 Houston, Texas June 19, 2008. Natural Gas Consumption, 2000–2008 (Billion cubic feet per day). OECD North America.

E N D
U.S. Natural Gas Storage and The Global LNG Market James M. Kendell Energy Information Administration James.kendell@eia.doe.gov LNG North American Summit 2008 Houston, Texas June 19, 2008
Natural Gas Consumption, 2000–2008(Billion cubic feet per day) OECD North America OECD Europe OECD Asia Source: International Energy Agency, Monthly Gas Data Service
World Underground Working Storage Capacity, 2006 (Trillion cubic feet) 14% 17% of Annual Gas Consumption 16% 1% Sources: Cedigaz, Underground Gas Storage in the World, June 2006; Energy Information Administration, Office of Energy Markets and End Use
Working Gas in U.S. Underground Storage, 2003-2008 Source: Energy Information Administration, Office of Oil and Gas, Natural Gas Monthly April 2008.
U.S. Natural Gas Production and Imports, 2003-2008 Production Imports Source: Energy Information Administration, Office of Oil and Gas, Natural Gas Monthly April 2008.
U.S. LNG Imports by Season, 2000-2008 (Billion cubic feet per day) Source: Energy Information Administration, Office of Oil and Gas, Natural Gas Monthly April 2008.
U.S. LNG Imports and U.S./U.K. Price Differentials, 2005-2008 U.S. LNG Imports U.S./U.K. Price Differentials Note: Import volumes for December 2007 and January 2008 are estimates. Source: Import data: DOE Office of Fossil Energy; Price data: EIA, derived as National Balancing Point spot price minus Henry Hub spot price.
Major Natural Gas Pipeline Corridor Expansions, 2005-2009 Note: MMcf/d = million cubic feet per day Source: Energy Information Administration, GasTran Gas Transportation Information System, Natural Gas Pipeline Projects Database.
U.S./U.K. Price Differentials, 2005-2008 History Future Differences in Forward Prices, +/- 1 Standard Deviation Source: Energy Information Administration – History: derived as the National Balancing Point spot price minus the Henry Hub spot price; June 2008 – June 2009: IPE forward price minus NYMEX price for future delivery at the Henry Hub.
Natural Gas Spot Price at the Henry Hub and Volatility, 2000-2008 Source: Derived by Energy Information Administration, Office of Oil and Gas.
Importers, Exporters, and World Liquefaction Capacity, 2005-2012 Source: Wood Mackenzie's Global LNG Online Service, Wood MacKenzie, Ltd; Shell Oil, as presented at the Energy Information Administration’s 2008 Conference, Washington D.C., April 6-7, (Proceedings available at http://www.iea.doe.gov/eia_conference_2008.html).
World LNG Short-term Trades, 1992-2007 Source: Andrew Flower LNG Associates, as presented at the Energy Information Administration’s 2008 Conference, Washington D.C., April 6-7, (Proceedings available at http://www.iea.doe.gov/eia_conference_2008.html).
History Potential Underground U.S. Natural Gas Storage Working Gas Capacity and Consumption, 2000-2009 Source: Capacity: Energy Information Administration, GasTran Gas Transportation Information System, Natural Gas Pipeline Projects Database. Consumption: Short-Term Energy Outlook, May 2008
U.S. LNG Imports, 2005–2009 (Billion cubic feet per Month) 2007 = 771 Bcf 2008 = 531 Bcf 2009 = 850 Bcf History Forecast Source: Energy Information Administration. History derived from Office of Fossil Energy data; Forecast: Short-Term Energy Outlook, June 2008
Recurring Publications: Annual Energy Outlook 2008, April 2008 (early release) Short-Term Energy Outlook, monthly International Energy Outlook 2007, May 2007 Special Reports: U.S. Natural Gas Imports and Exports: Issues and Trends 2006, February 2008 U.S. Underground Natural Gas Storage Developments: 1998-2005, October 2006 Estimate of Maximum Underground Working Gas Storage Capacity in the United States: 2007 Update,October 2007 James M. Kendell Energy Information Administration James.Kendell@eia.doe.gov