Download
1 / 13
130 likes | 309 Views
Training and Action for Patient Safety Red flags documentation in back pain. Dr Danielle Hann. What is TAPS. 20 week programme run by the Improvement Foundation Multi-disciplinary Aims to improve safety through ‘ action learning ’ Identify a local priority for patient safety

E N D
Training and Action for Patient SafetyRed flags documentation in back pain Dr Danielle Hann
What is TAPS • 20 week programme run by the Improvement Foundation • Multi-disciplinary • Aims to improve safety through ‘action learning’ • Identify a local priority for patient safety • Develop solutions • Implement solutions • Measure improvement
Statement of Patient Safety Issue • Patient safety problem • There is a difference in GP perception and documentation of red flags in back pain • There is a problem because • There is a lack of consensus and we are not documenting the same thing. Some red flags could be missed and patients put at risk
Measures for Improvement • What are we trying to achieve? • Improved GP knowledge of the red flags of back pain • better documentation, i.e 100% documentation of red flags • Outcome measures • Measure 1 • The number of patients presenting with back pain • Measure 2 • The percentage of patients with back pain that have red flags documented
Actions • Weekly audit of notes to record the number of attendances with back pain and the percentage with red flags documented • Questionnaire of clinical staff • Educational event • Laminated red flag card in every room • Bar chart of individual doctors percentage (anonymous!) • Information sent round regarding accurate read codes
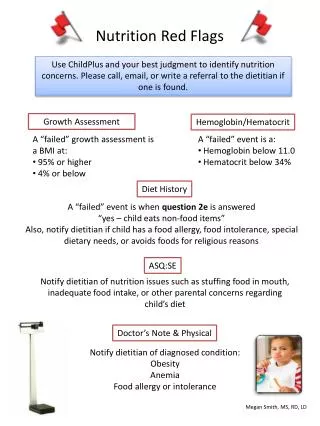
Red Flags Answers from clinical staff Age of onset <20 or >50 9/10 History of trauma 5/10 Systemic illness/constitutional symptoms e.g. fever, chills, malaise, lethargy, weight loss 10/10 Immunosupression/steroid use 2/10 Neurological symptoms e.g. motor/sensory disturbance, disturbed gait, incontinence, saddle anaesthesia, reduced anal tone 10/10 Unrelenting pain 8/10 History of cancer 7/10 Questionnaire Results
Basics of a run chart • There needs to be 10 points of data to establish a baseline • 8 data points either side of the base line indicates an effect • If there are 5 successive increases or decreases in the measures this also indicates change
Limitations • Data is only as good as the coding • Sustainability • Changing peoples practice
Conclusions • Increased percentage of red flags documented • Bar charts of individual results seem to be a powerful tool • Need to sustain the positive changes and improve them