Download
1 / 8
80 likes | 210 Views
University of Warwick, Department of Sociology, 2012/13 SO 201: SSAASS (Surveys and Statistics) (Richard Lampard ) Week 6 More ‘Loose Ends ’ ( from the Wednesday session). Regression line: LRSCALE = 11.139 + (0.877 x SEX) + (0.062 x INCOME) + (-0.014 x (SEX x INCOME)). Results from

E N D
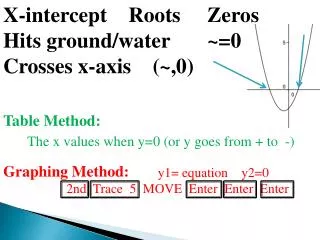
University of Warwick, Department of Sociology, 2012/13SO 201: SSAASS (Surveys and Statistics) (Richard Lampard)Week 6More ‘Loose Ends’( from the Wednesday session)
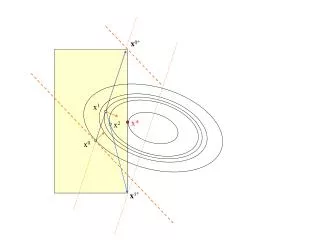
Regression line: LRSCALE = 11.139 + (0.877 x SEX) + (0.062 x INCOME) + (-0.014 x (SEX x INCOME)) Results from interaction example Interaction term WOMEN (SEX = 1) MEN (SEX = 0)
Is the impact of age on left-right scale score linear? • When age2 [more precisely, age2/100] is added to the regression alongside age, the r-squared value only increased marginally, from 0.0060 to 0.0061 • More specifically, expressed as a sum of squares, the variation explained only rises from 297.7 to 305.7. Given that the value for the sum of squares per source of unexplained variation is 13.4, this increase of 8.0 is negligible.
Does this mean that the relationship is linear? • One possibility is that the relationship only differs from linearity because of sampling error. • BUT, more plausibly, the ‘shape’ of the relationship may not be addressed effectively by simply adding a squared term. • What happens if we also add the cube of age (i.e. age3)? [More precisely, age3/10000]
Hurray! (again…) • As can be seen from the preceding slide, adding a cubic term increases the explained sum of squares by about 150! • And, when included together, all three age-related terms (i.e. linear, squared, and cubed) are statistically significant (p<0.05) • So the curvature of the age/left-right scale relationship is better represented by a line (in fact, a curve!) based on age, age2, and age3 (see next slide)
Score Age
But… • In fact the curve shown in the preceding slide doesn’t match the scores for ages above 85 at all well; there are, however, sufficiently few people of such ages in the sample that they don’t have much impact on the positioning of the regression line… • While the chapter in Marsh and Elliott (2009) discusses a range of possible, commonly-used transformations, there is no guarantee that the form of a relationship will match up that well to any of these!!


![定理15.8:对 f(x) F[x],g(x) F[x], g(x) 0, 存在唯一的 q(x),r(x) F[x], degr(x)<degg(x) 或 r(x)=0, 使得:](https://cdn2.slideserve.com/4132616/slide1-dt.jpg)