Download

1 / 42
440 likes | 643 Views
Job Openings and Labor Turnover (JOLTS). AUBER 2011 Fall Conference Indianapolis, Indiana October 9, 2011. Labor Market Data. Employment Current Employment Statistics (CES) Unemployment Current Population Survey (CPS) Labor dynamics—worker flows Job Openings and Labor Turnover (JOLTS).

E N D
Job Openings and Labor Turnover(JOLTS) AUBER 2011 Fall Conference Indianapolis, Indiana October 9, 2011
Labor Market Data • Employment • Current Employment Statistics (CES) • Unemployment • Current Population Survey (CPS) • Labor dynamics—worker flows • Job Openings and Labor Turnover (JOLTS)
JOLTS Data Elements • Employment (pay period of the 12th) • Job openings (last day of the month) • Hires (full month) • Total Separations (full month) • Quits • Layoffs and Discharges • Other Separations
JOLTS Survey Scope 16,000 establishments sampled from: • Nonagricultural industries • All 50 states and the District of Columbia • Private sector and government • All size classes
Uses ofDemand and Churn Data • Identify types of unemployment • Structural: mismatch of workers/jobs • Frictional: movement of workers • Cyclical: business cycle • Indicate health of the labor market • Job openings high or low? • Quits high or low? • Layoffs high or low? • May have leading indicator properties
Importance of JOLTS • Three Economists won the 2010 Noble Prize in Economics “for their analysis of markets with search frictions” • Peter Diamond, MIT • Dale Mortensen, Northwestern University • Christopher Pissarides, London School of Economics • Used JOLTS data in their Nobel Prize Speeches • Search and matching labor market models
JOLTS Symposium • December 10, 2010 at BLS • Purpose: Bring together leading academic and policy users of JOLTS data • Five research papers presented • Roundtable discussion • How can we improve JOLTS? • Conference Report: JOLTS Symposium • February 2011 Monthly Labor Review
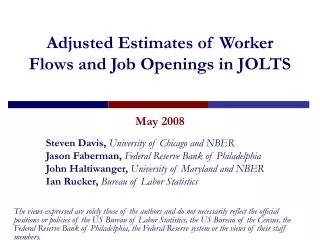
JOLTS Symposium Papers • “The Establishment-Level Behavior of Vacancies and Hiring” • Steven J. Davis, University of Chicago • R. Jason Faberman, Federal Reserve Bank of Chicago • John C. Halterwanger, University of Maryland
JOLTS Symposium Papers • “What Drives Movements in the Unemployment Rate? A Decomposition of the Beveridge Curve” • Regis Barnichon, Federal Reserve Board of Governors • Andrew Figura, Federal Reserve Board of Governors
JOLTS Symposium Papers • “Which Industries are Shifting the Beveridge Curve” • Regis Barnichon, Federal Reserve Board of Governors • Michael Elsby, University of Michigan • Bart Hobijn, Federal Reserve Bank of San Francisco • AysegulSahin, Federal Reserve Bank of New York
JOLTS Symposium Papers • “Evaluating and Comparing Leading Indicators for Employment” • Gad Levanon, The Conference Board
JOLTS Symposium Papers • “JOLTS as a Timely Source of Data by Establishment Size” • Alan Krueger, Princeton University • Sarah Charnes, US Department of Treasury • Monthly Labor Review, May 2011, Vol. 134, No. 5
JOLTS Symposium Roundtable • Improvements within the existing program • JOLTS by size class • Improvements with more sample • More industry detail • More geographic detail
JOLTS Symposium Roundtable • Improvements Requiring More Questions on the Form • Job Openings • Skill level (Occupation, Education) • Recruiting Intensity • Duration of Job Openings
JOLTS Symposium Roundtable • Hires • Occupation • Demographics • Wages • Type of position (permanent, temporary, seasonal) • From Unemployment or another job • Replacement hire or growth hire • Formal or informal posting
JOLTS Symposium Roundtable • Separations • Tenure • Occupation • Demographics
Demand for Size Class Data • Size class data allows analysis of employment patterns over time and through the business cycle for firms of different sizes. • Many policy makers and economists believe small firms are the key to job creation. • With lending tight after the recession, small firms struggle to afford hiring.
Demand for Size Class Data • “Sizing up Job Creation”, Phil Davies, Banking and Policy Issues Magazine, September 2010, The Federal Reserve Bank of Minneapolis, http://www.minneapolisfed.org/publications_papers/pub_display.cfm?id=4538
Firm vs. Establishment From the Business Employment Dynamics question and answer page: What is the difference between establishment data and firm data?An establishment is defined as an economic unit that produces goods or services, usually at a single physical location, and engaged in one or predominantly one activity. A firm is a legal business, either corporate or otherwise, and may consist of one establishment, a few establishments, or even a very large number of establishments.
First official request for JOLTS size class estimates • Alan Krueger, April 2010 while Assistant Secretary of the Treasury • Chief Economist at Dept of Labor, 1994-95 • Professor at Princeton • Nominated in August 2011 by President Obama to be chairman of the White House Council of Economic Advisers • Used the data in his presentation of the Treasury statement about job growth to the Joint Economic Committee on May 5, 2010
JOLTS Establishment-Based Estimates • For Total Private only • Rates and Levels • NSA and SA, but only SA released to the public • Available upon request by emailing JoltsInfo@bls.gov • File for public release updated quarterly
Users of JOLTS establishment-based size class estimates • U.S. Department of the Treasury • U.S. senators: Oregon, Maryland • The Conference Board • U.S. Congress Joint Economic Committee • Federal Reserve Banks: NY, Boston • The Wall Street Journal • Moody’s
Users of JOLTS establishment-based size class estimates (Con’t) • Ray Stone of Stone & McCarthy Research Associates • Manpower • Universities: Yale, Princeton, Harvard, Northwestern, U. of Virginia, U. of Maryland • The Brookings Institute • Organisation for Economic Co-operation and Development (OECD)
Job Openings Analysis • Job openings began falling prior to the beginning of the recession in Dec 2007 • All size classes reached low points during 2009 • 5,000 employees: Rate higher than at the start of recession • 250-999 employees: Rate very close to pre-recession levels • 10-49 employees: Recovered the least
Hires Analysis • Hires began falling prior to the beginning of the recession in December 2007 • Size classes reached low points in 2009 and 2010 • Strongest recovery: 250-999 employees • Weakest recovery: 50-249 employees
Quits Analysis • Quits began falling prior to the beginning of the recession in December 2007 • Size classes reached low points in 2010 or early 2011 • Strongest recovery: 1,000-4,999 employees • Weakest recovery: 5,000+ employees
Layoffs & Discharges Analysis • Layoffs & discharges began to rise after the beginning of the recession in December 2007 • Size classes reached high points in 2008 or in 2009 • Layoffs and discharges are at or below pre-recession levels for all but the smallest size class (1-9 employees)
Other Separations Analysis • Other Separations is a very small number with considerable variance, making analysis difficult. • The two largest size classes (1,000-4,999 and 5,000+) have a slight downward trend beginning before the start of the 2007 recession.
Firm size research • Demand continues to be for firm-based size class estimates. • BLS is currently researching firm-based estimates.