Visual Acuity
Visual Acuity. Walter Huang, OD Yuanpei University Department of Optometry. Definition. The resolving power of the eye used to assess and quantify the eye’s ability to resolve varying letter sizes Visual acuity is dependent on: The refractive error of the eye

Visual Acuity
E N D
Presentation Transcript
Visual Acuity Walter Huang, OD Yuanpei University Department of Optometry
Definition • The resolving power of the eye used to assess and quantify the eye’s ability to resolve varying letter sizes • Visual acuity is dependent on: • The refractive error of the eye • The health and the integrity of the eye • The test targets used • The test conditions
Measurement • The measurement of VA is done to monitor change in vision with disease progression of disease and/or treatment plan • It is a way to measure “blur” vision • Visual acuity must be measured on every patient at every visit!
Standard Test Distances • Distance visual acuity (DVA) • 20ft or 6M is equivalent to optical infinity • Near visual acuity (NVA) • 40cm
Weymouth Classification of Visual Acuity Measurements • Minimum distinguishable (or minimum visible) • The ability to see something as being distinguishable from the background • Minimum separable • The ability to determine a group of points or lines as separate and distinct • Minimum cognizable or legible • The ability to form sense (e.g., Landolt C) or minimum legible (e.g., letters or numbers)
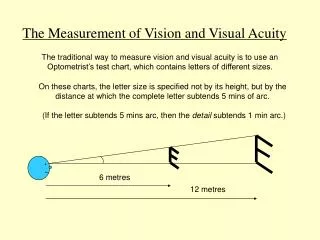
History • Early astronomers found two stars resolvable as separate if the distance between the stars subtend an angle of at least 1 minute of arc
Snellen Test • In 1862 Snellen and Giraud-Toulon introduced a system for measuring VA • A form of minimum legible visual acuity task • Snellen acuity is based on a minimum angle of resolution of 1 minute of arc • Visual acuity target designs: optotypes • The Snellen optotype has overall dimensions that are 5 times the detail
Snellen Notation • Snellen fraction • Test distance divided by the distance at which optotype would subtend 5 minutes of arc at the retina • The denominator of the Snellen fraction is termed the foot-letter size • The letter’s overall size, both angularly and linearly • The average emmetrope has a VA of 20/20 or better • This is based on a test distance of 20ft • The classic Snellen fraction is the reciprocal of the minimum angle of resolution (MAR)
Snellen Test • Snellen equivalent • If the test distance is not 20ft, the measured Snellen fraction may be used to predict what the patient’s VA would be for a 20ft distance • Example • Patient can resolve a 30ft letter at a test distance of 15ft. The Snellen acuity is 15/30. • 15/30 =20/x • x = 40 • The Snellen equivalent is 20/40
Calculating a Visual Acuity Test Object’s Foot-Letter Designation • Example of a letter that is 2cm tall
Types of Distance Visual Acuity Charts • Wall charts • Testing VA in literate adults • Printed on cardboard and mounted on a wall • Well-suited for vision screenings and doctors’ offices • Variations: Tumbling E chart, Landolt C chart, Bailey-Lovie chart
Types of Charts • Hand-held visual acuity cards • Primarily for children in vision screenings • Simplest form is the letter E in different sizes printed onto hand-held cards • Free space testing
Types of Charts • Chart projectors • Projects test objects onto a screen • Standard chart projector can be calibrated for varying testing distances between 10ft and 20ft • Optically “fold” the testing distance using mirrors to create appropriate testing distance (20ft is the standard)
Calibration of Chart Projectors • Measure the testing distance • Calculate how large an optotype would have to be on the screen to represent 20/200 for that testing distance • Adjust the lenses in the chart projector until the letter size from the previous step is achieved
Calibration of Chart Projector • A 20 foot-letter is 8.87mm. May use direct proportions to calculate the letter size that would be needed to represent 20/20 for any possible testing distance. • Example • 8.87mm/20ft = x/17ft • x = 7.54mm
Recording • Record the VA line for which more than 2 letters (or less than half the number) are read incorrectly
Recording • Examples • Two out of five letters on the 20/20 line are read incorrectly • 20/20 -2 • All letters on the 20/20 line are read correctly, and one letter on the next line down is read correctly • 20/20 +1 • One of the letters on the 20/20 line is read incorrectly, and two letters on the 20/15 line are read correctly • 20/20 -1/+2
Recording • Points to consider • Ask the patient to read a line over again or show the letters to the patient one line at a time • Isolate lines on the chart to avoid distracting influences • May consider showing the patient a line of the same VA on a different slide, if the projector has more than one slide
Expected Findings A visual acuity of 20/20 or better is considered normal The difference between the two eyes should be no greater than one line
Pinhole Visual Acuity • Purpose • To determine if a decrease in vision is correctable by lenses • Pinhole visual acuities are taken when the patient’s entering VA is worse than 20/30 at distance and near through the habitual correction
Expected Findings If the cause of the patient’s decreased visual acuity is due to an uncorrected refractive error, the VA is expected to improve through the pinhole If the cause of decreased visual acuity is not optically based, no improvement, and possibly a decrease, will occur through the pinhole
Near Visual Acuity • Testing the VA at close range (usually 40cm) • Near visual acuities are taken through the habitual correction • The purpose is to detect people with near vision difficulties (e.g., uncorrected high hyperopia, accommodative dysfunction) • In patients over 40 years old, the reduced near visual acuity is one of the symptoms of presbyopia
Near Vision Charts • Types of notation • Reduced Snellen Acuity card • Test distance at 16in (or 40cm) • Jaeger Acuity Card • 20 letter sizes classified J1 to J20 • Test distance at 14in • Point system • Each point is 0.35mm • M notation • Based on meter unit