Observational Studies
Observational Studies. C. Wanner Würzburg, Germany. 1402 - 2002. 600 years University Würzburg .


Observational Studies
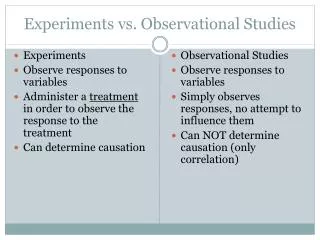
E N D
Presentation Transcript
Observational Studies C. Wanner Würzburg, Germany 1402 - 2002 600 years University Würzburg Clinical Epidemiology in Nephrology European Renal Association, European Dialysis and Transplant Association XLI Congress, May 15-18, 2004, Lisbon, Portugal
An early Clinical Trial (N = 2)In the late 18th century, King Gustav III of Sweden decided that coffee was poison and ordered a clinical trial.J Int Med, October 1991:289 - Introduction to editorial from Nordic School of Public Health, Goteborg, SwedenReprinted in Ann Intern Med 1992;117:30
Study design- The king condemned a convicted murderer to drink coffee every day.- Control: another murderer was condemned to drink tea daily.- Outcome: death.- Two physicians were appointed to determine the outcome.
Results- The two doctors died first.- The king was murdered.- Both convicts enjoyed long life until the tea drinker died at age 83 (no age was given for the coffee drinker).
DiscussionOne should not rely on such a small sample size. Perhaps the end point was too hard.The outcome of the trial had no effect on the decision makers. Coffee was forbidden in Sweden in 1794 and again in 1822.
ConclusionsNone possible. External events and other biases may have confounded the result. Kings should not mess with clinical trials.
Observational Studies Dominate the literature Funai et al. Distribution of study designs in four major US journals ...... Gynecol Obstet Invest 2001;51:8-11
THE LANCET 2002;359:57- 61 Algorithm for classification of types of clinical research
Hierarchy of Evidence 1. Meta-analysis with original data 2. Confirmed RCTs including meta-analysis 3. Simple randomized control trials (RCT) 4. Series based on historical control groups 5. Case control observational studies 6. Analyses using computer databases 7. Series with literature controls 8. Case series without controls 9. Anecdotal case reports J Clin Epidemiol 1995; 48:135
THE LANCET 2002;359:57- 61 Algorithm for classification of types of clinical research
Taxonomy of clinical research Descriptive studies do not feature a comparison (control) group. Descriptive studies are often the first foray into a new area of medicine. They describe the frequency, natural history, and possible determinants of a condition. Hypothesis generation about the cause ot the disease. They do not allow assessments of causal association. Case report Case-series reports
Descriptive studies Good descriptive reporting answers the five basic W questions: Who, what, why, when, where And a sixth: so what ? Who has the disease in question ? What is the condition or disease being studied ? Why did the condition or disease arise ? Where does or does not the disease or condition arise ? Case report Case-series reports Surveillance studies
Comparison of the Characteristics of Cohort Study & Usually very expensive Complete source population denominator experienced tallied Can calculate incidence rates or risks and their differences and ratios Convenient for studying many diseases Case-Control Studies Usually less expensive Sampling from source population Can usually calculate only the ratio of incidence rates or risks Convenient for studying many exposures
Oral contraceptives Ovarian cancer
…... several famous large cohort studies continue to provide important information …..Ndoll R, Peto R, Boreham J, Sutherland I.Smoking and dementia in male British doctors: prospective study. BMJ 2000;320:1097-1102
An early non-randomized concurrent control comparison(May 20, 1747) • Cider • Elixir vitrol • Vinegar • Sea water • Nutmeg plus a mixture of garlic and mustard • Fresh fruit (2 oranges and 1 lemon daily for 6 days) James Lind, a Scottish physician, on board of HMS Salisbury, divided 12 sailors with scurry into 6 groups of 2 sailors and given one of the following treatments:
Ovarian cancer Use of oral contraceptives Control group
Ovarian cancer Use of oral contraceptives Control group Problem:adequate control group (matching) and recall bias. Because case-control studies lack denominators, incidence rates, relative risks or attributable risks cannot be calculated. Instead odds ratios are the measures of association.
Although easier to do, they are also easier to do wrong: • Define the criteria for diagnosis of a case and any eligibility criteria used for selection. • Controls should come from the same population as the cases, and their selection should be independent of the exposures of interest. • Blind the data gatherers to the case or control status of participants or, if impossible, at least blind them to the main hypothesis of the study. • Data gatherers need to be thoroughly trained to elicit exposure in a similar manner from cases and controls (memory aids) • Address confounding in case-control studies, either in the design stage or with analytical techniques.
Another case-control study: Germans like to go on cruise ships. On such a ship, the entire universe of those at risk is known. Those with vomiting and diarrhoea are asked about food exposure, as are a sample of those not ill. If a higher proportion of those ill reports having eaten a food than those well, the food becomes suspect. In this way German potato salad on a ship was linked with a serious outbreak of shigella resistant to several antibiotics. Am J Epidemiol 1991;134:413-420
Cross-sectional Study Exposure Outcome at the same time 300 men MI next door neighbour S-cholesterol 256 mg/dl 202 mg/dl
A cross-sectional study with longitudinal follow-up CRP 1.0 0.8 0.6 0.4 0.2 0.0 £3.4 mg/L 3.5–7.6 mg/L Surviving 7.7–16.5 mg/L >16.5 mg/L n = 663 Time (months) 0 12 24 36 48 60 Kidney int 2002;62:1791-1798
What to look for in observational studies ? What reviewers do !
ProfessorGrand rounds: „We should evaluate our clinical charts how treatments are working!“ Observation: High cardiovascular mortality ! Question: What to do ? Idea: Aspirin treatment Literatur search: Idea confirmed, no data found ! Study design: Established during grand rounds !
312 hemodialysis patients, 115 cases on aspirin 100-300 mg/d, 197 without aspirin (controls) 100 90 80 Survival (%) 70 - aspirin 60 + aspirin 50 0 5 10 15 20 25 30 35 Follow-up (months) Schwedler, Schinzel, Metzger, Wanner. Kidney Int 2002;62:301-310
Lancet 2002;349-248-253 Is selection bias present ? In a cohort study, are participants in the exposed and unex-posed groups similar in all important aspects except for the exposure ? In a case-control study, are cases and controls similar in all important aspects except for the disease in question ?
Is information bias present ? In a cohort study, is information about outcome obtained in the same way for those exposed and unexposed ? In a case-control study, is information about exposure gathered in the same way for cases and controls ? Is confounding present ? Could the results be accounted for by the presence of a factor e.g. age, smoking, inflammation, diet-associated with both the exposure and the outcome but not directly involved in the causal pathway ?
312 hemodialysis patients, 115 cases on aspirin 100-300 mg/d, 197 without aspirin (controls) 100 90 80 Survival (%) 70 - aspirin 60 + aspirin 50 0 5 10 15 20 25 30 35 Follow-up (months) Aspirin (37%; n=115), CRP 18.2 ± 26 mg/dl; No Aspirin, CRP 15.5 ± 24 (p< 0.05) VD (40%; n=125), CRP 19.5 ± 30 mg/dl; No VD CRP 14.1 ± 21 (p< 0.05) VD, vascular disease; CRP, C-reactive protein
Confounder:Underlying vascular diseaseSelection bias:Patients with high CRP (outcome biomarker) were selected for aspirin treatment
If the results cannot be explained by these three biases, could they be the result of chance ? What are the relative risk or odds ratio and 95% CI ? If the results still cannot be explained, then (and only then) might the findings be real and worthy of note !
Serum Cholesterol in Renal Failure in 1999 and the Risk to die in 2000 JASN 2003;14: 260A Serum Cholesterol mmol/L
Reverse Causality Confounding by Disease Problem: associations between risk factors and cardiovascular disease outcomes are confounded by pre-existing cardiac, renal and other comorbid disease !
Features to look for in a cohort study • What steps were taken to minimise information bias? • Was the outcome clear, specific and measurable ? • Was the outcome identified in the same way for both groups ? • Was determination of outcome made by an observer blinded as the treatment ?
Features to look for in a cohort study • How complete was the follow-up of both groups ? • What efforts were made to limit loss to follow-up ? • Was loss to follow-up similar in both groups ?
Features to look for in a cohort study • Were potential confounding factors sought and • controlled for in the analysis? • Did the investigators anticipate and gather information on potential confounding factors? • What method(s) were used to assess and control for confounding?
Propensity scores, a method to reduce potential bias in observational studies and to balance observed baseline covariates in two treatment groups. Propensity score: numerous covariates that can be condensed into a single scalar variable. Once estimated, propensitiy scores can be used for analyses of outcomes as covariates in multivariate models, as matching factors, or to define strata for separate analysis. Rosenbaum PR, Rubin DB. The central role of the propensity score in observational studies for causal effects. Biometrika 1983;70:41-55
Asking the right question „Paper or plastic?“
Studies need to have both internal and external validity: the results should be both correct and capable of extrapolation. A simple checklist for bias (selection, information, and confounding) then can help readers decipher research reports.
? or