Download
1 / 33
330 likes | 453 Views
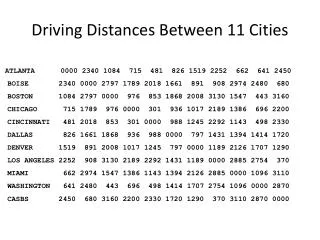
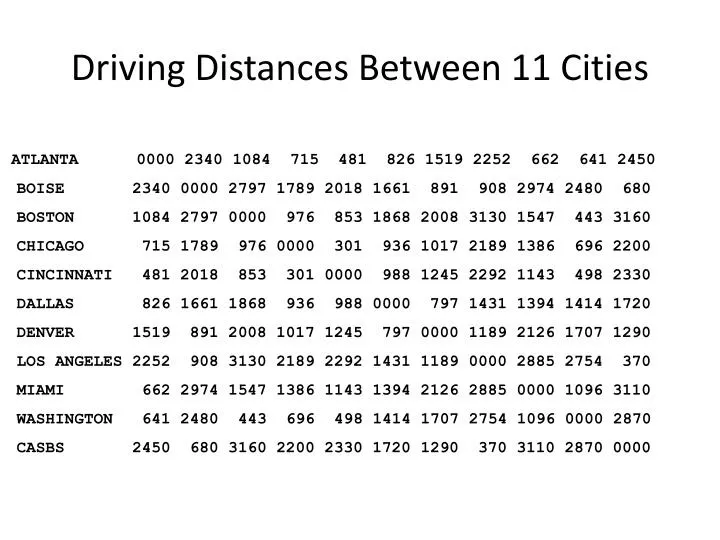
Driving Distances Between 11 Cities. ATLANTA 0000 2340 1084 715 481 826 1519 2252 662 641 2450 BOISE 2340 0000 2797 1789 2018 1661 891 908 2974 2480 680 BOSTON 1084 2797 0000 976 853 1868 2008 3130 1547 443 3160

E N D
Driving Distances Between 11 Cities ATLANTA 0000 2340 1084 715 481 826 1519 2252 662 641 2450 BOISE 2340 0000 2797 1789 2018 1661 891 908 2974 2480 680 BOSTON 1084 2797 0000 976 853 1868 2008 3130 1547 443 3160 CHICAGO 715 1789 976 0000 301 936 1017 2189 1386 696 2200 CINCINNATI 481 2018 853 301 0000 988 1245 2292 1143 498 2330 DALLAS 826 1661 1868 936 988 0000 797 1431 1394 1414 1720 DENVER 1519 891 2008 1017 1245 797 0000 1189 2126 1707 1290 LOS ANGELES 2252 908 3130 2189 2292 1431 1189 0000 2885 2754 370 MIAMI 662 2974 1547 1386 1143 1394 2126 2885 0000 1096 3110 WASHINGTON 641 2480 443 696 498 1414 1707 2754 1096 0000 2870 CASBS 2450 680 3160 2200 2330 1720 1290 370 3110 2870 0000
Table 2.4 Driving Distances as an Unfolding Problem • Houston NYC Orlando Portland St Louis San Diego Atlanta 790 850 430 2660 570 2150 • Boise 1820 2490 2640 430 1670 980 • Boston 1830 210 1300 3140 1210 2880 • Chicago 1090 810 1150 2120 290 2090 • Cincinnati 1150 470 1000 2430 320 2290 • Dallas 250 1560 1100 2040 660 1350 • Denver 1030 1790 1880 1260 860 1100 • Los Angeles 1540 2790 2430 960 1840 130 • Miami 1190 1330 230 3260 1230 2680 • Washington 1370 240 850 2780 860 2600 • San Francisco 1890 2960 2850 670 2150 490
The NOMINATE (Nominal Three-Step Estimation)Voting Model • Each Legislator is represented by a Point • Each Roll Call Vote is represented by two points, • one corresponding to the Yea Outcome, • and one corresponding to the Nay Outcome • Legislators vote Probabilistically for the closest Outcome