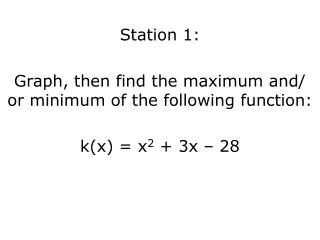
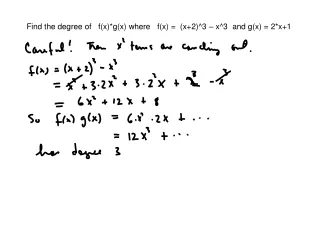
Find the inverse of g(x), where
Copy Worked example 1.8 b more challenging. Find the inverse of g(x), where. This would be difficult to draw as function machine – so it is best to do it the new way. Rearrange for y. The line where most students give up or do something stupid. Copy Title: Modulus function. Copy Notes
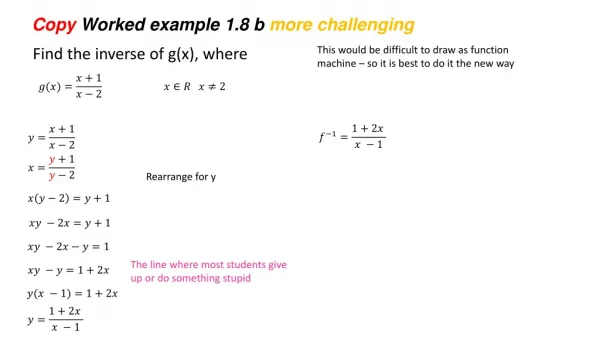

Find the inverse of g(x), where
E N D
Presentation Transcript
Copy Worked example 1.8 b more challenging Find the inverse of g(x), where This would be difficult to draw as function machine – so it is best to do it the new way Rearrange for y The line where most students give up or do something stupid
Copy Title:Modulus function Copy Notes The modulus function finds the absolute value of a number. Any negative sign in front of a number is disregarded and a positive answer is returned. Consider the function box below. 3 3 -7 7
Copy Notes The modulus of x is written as _____ and is usually read as 'mod x'. On a calculator it is “ABS” since it finds the absolute value a x.
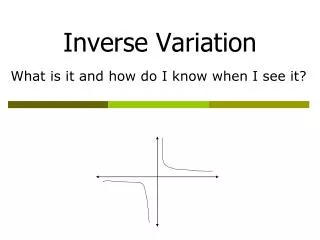
Lets think how this looks on a graph – we will start with a simple one Take the x values as positive When x > 0 (bigger than zero) The graph is just y=x At the zero point it is the same But what happens when x<0 (less than zero) You are actually drawing the line y=-x
There are 2 ways to think about this – you must look at both (sometimes you are forced into your non preferred method) COPY NOTES Method 1 Thing about what is happening to the number Method 2 Graphically (easy but dangerous)
Copy Notes/Examples Method 1 Worked example 2.5 Sketch the graph of y =|x – 3| You need to understand both methods as they can ask questions that use either method Method 1 Draw the line y Find the critical point where it changes (x-3 will be negative once X equals three) Consider X equals 2 But as we are considering only positive values for y - then it equals 1 In fact the |x-3| for negative values look like this y = -x +3 What have you done What does y = |x-3| mean These two lines y
Copy Notes/Examples Method 2 Worked example 2.5 Sketch the graph of y =|x – 3| Method 2 Draw y = x - 3 Consider the effects of the modulus at that point is to produce only positive values of y Method 2 IS DANGEROUS – RESERVE IT FOR EASY QUESTIONS The other way of producing positive values of y is to reflect in the x-axis This is very useful and quick to do but it's potentially dangerous to only know this way. The way they ask questions in the exam is to trick you to into thinking you just have to reflect in the x-axis. Sometimes this is the case but sometimes you have to think about it so you must be able to think about it the first way.
Before we move on to the tricky questions just check you can do it Do in rough
Copy Notes/Examples – (Can be done by the easy method) Worked example 2.6 Sketch the graph of Think about critical points they occur at y = 0 0 4 For what area of the graph is Y actually negative How can you make why positive This example would work if you just use the rule reflect in the X axis but it doesn't always work we will see a minute
Copy /Do Example – (Can be done by the easy method) Worked example 2.6 b Sketch the graph of Draw y=sin x In this example you can simply in the x axis because all the y values must be postive Effectively this is because you are looking at In these cases you can use the simply way
Where it can be more complicated than simply reflecting in the X I will go through an example trying to look at the complication and then we will work through a separate example together for your notes This is hard until you get it – you need to ask and explain to me what you don’t understand and I will try to help you
Lets look at more complicated examples … Worked example 2.7 (a) Sketch the graph of y = 3 — |x| First think of y = 3 – x and sketch it Where of x positive – it will stay the same here What is happening at x = zero What is happening to negative values of x – remember these must all be made positive. Howdoesthiseffectthedrawing / theequation line What to do with less thinking Draw the line Consider the point where it changes to negative x values Think about how the equation is effected ( as x values become negative) Draw the line
1. Establish Critical Point Copy Example Draw the line 2. Draw the two lines 3. Think about which section you are going to keep Remember the modulus part can only be zero or bigger First consider the difficulty You can deal with to modulus by reflecting in the x axis. The maths of this the to times by -1 Find the critical point
It takes time to develop the your understand of this method - 1. Establish Critical Point 2. Draw the two lines 3. Think about which section you are going to keep Remember the modulus part can only be zero or bigger
Do exercise 2c page 33 start where you know you can I would advise starting at number 4 to consolidate and then test your understanding