Download
1 / 98
980 likes | 1.09k Views
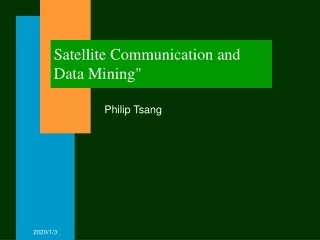
Satellite Data Mining Sameh, Sultan(WM), Kassem (KFU), Rashid, Fakhry, Khalid 2 years- SR 79,000- Comm : Saudi Geological Survey in Jeddah -Multimedia Data Mining -Remote Sensing -Background Knowledge

E N D
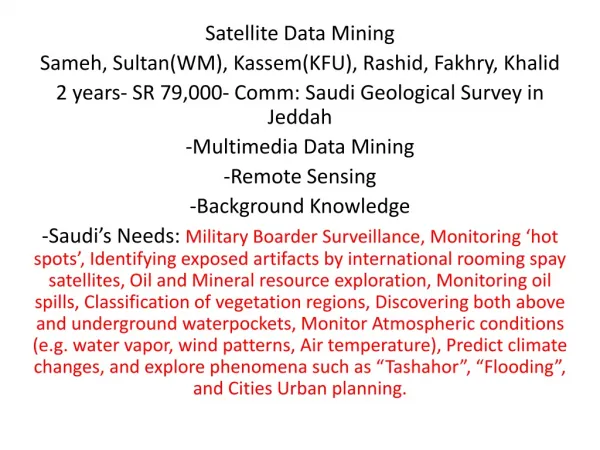
Satellite Data Mining Sameh, Sultan(WM), Kassem(KFU), Rashid, Fakhry, Khalid 2 years- SR 79,000- Comm: Saudi Geological Survey in Jeddah -Multimedia Data Mining -Remote Sensing -Background Knowledge -Saudi’s Needs: Military Boarder Surveillance, Monitoring ‘hot spots’, Identifying exposed artifacts by international rooming spay satellites, Oil and Mineral resource exploration, Monitoring oil spills, Classification of vegetation regions, Discovering both above and underground waterpockets, Monitor Atmospheric conditions (e.g. water vapor, wind patterns, Air temperature), Predict climate changes, and explore phenomena such as “Tashahor”, “Flooding”, and Cities Urban planning.
-The project will deliver an integrated system developed on top of standard platform of fast Oracle databases of Saudi satellite images composed of its different regions at different resolutions supported by clever images’ indexing techniques. -It will also build a powerful library of algorithms on top of standard Matlab image processing toolbox, using GIS data. -The integrated system will be unique in targeting Saudi’s needs in such comprehensive and cross-correlated manner mixing both images databases and text background knowledge databases. -correlating “Tashahor” with wind patterns and soil moisture prediction will make use of three types of images databases (Tashahor, winds, and soil) along with a text background knowledge database that stores previous knowledge about these issues specific for Saudi Arabia -Visualization using Google Earth as background
-integrating “Remote Sensing”, “Geographical Information System” with “Data Mining”. To our knowledge such federation of databases and techniques never been investigated before. -The project scope will narrow its focus to one issue at a time. As a starter we will explore the rich area of Geological data, background knowledge, and specific hydrological investigation queries. Domain-specific experts and historical knowledge will be the main source of background text data. -Saudi Geological Survey is providing us with three data sets: Flooding in Jeddah , Water Pockets in Al-Robeh Al-Khaly, and Minieral Exploration of Gold in Gazan
-Mohamed Sultan (Prof. of GeoScience, Western Michigan University) -With Farouk El-Baz as a Chair Professor of Al-Roubeh El-Khaly in KSU -Hill Sliding Project with SGS in Gazan -Will visit us Jan. 8,9th Findings: This project takes the field of remote sensing to higher grounds by applying knowledge discovery techniques of data mining utilizing a set of background knowledge. Intra- and Inter- Correlation queries and the federation of both images and text databases are new concepts in the field of remote sensing. It is our hope that applying such new concepts will lead to interesting finding at the various areas of Saudi’s needs.
The end product (methodology + applied) should be able to answer both Intra-Correlation queries and Inter-Correlation queries. In answering these queries, we target the following goals and objectives: 1- Better understanding of the interplay of mixing remote sensing operations with background knowledge 2- Effective decoupling of the data mining algorithms, background knowledge, and the image databases 3- Efficient acceleration of the federation of databases for fast data accesses 4- Flexible scripting of the queries within the architecture to implement an open system 5- Distributed architecture (Client/Server) with web support 6- Ensuring scalability and abstraction of functionality 7- Assure effective responses to both Intra- and Inter- Correlation queries 8- Ensure efficient deployment (minimal client installation and on-demand dynamic loading of components) 9- Provide appropriate visual results interpretation- Google Earth
Google Earth Google Earth
A linear transformation of a multivariate dataset (multispectral image) into a new coordinate system Reduce the dimensionality (decorrelation) of the data set while retaining most of the variance Eigenvalues of covariance matrix
Texture Feature Extraction • Texture feature representation • statistics model • co-occurrence matrices • probability model • Markov random fields parameters • transform-based model • Gabor wavelets • A two-dimensional Gabor function and its Fourier transform • Feature representation • Gabor wavelet transform of an image (PCA 1 region) • mean and standard deviation of the magnitude of the coefficients • feature vector
Category-based Clustering • Partition the texture feature space into subspaces in terms of the combined land cover classes water/wetlands river/grassland forest/pasture crops/pasture urban/grasslands
-For example, previously known knowledge about “Flooding” regions in the Kingdom and the previous experience gain from such historical events are collected and coded into such text background databases. As another example, oil spills occur both in the open sees and along the coasts, so background information about major shipping routes and anchorage areas will help in locating potentially vulnerable areas
-Data Fusion: RS automatic cloud detection + RS change in soil moisture + Field Rain gauges + Field Vegetation intensity + Field soil maps + Field aquifer characteristics -Data Sets from SGS by Prof. Sultan -His work with Farouk El-Baz in Robh Al-Khaly
-Finding: 27% of the average annual precipitation over the Arabian Peninsula is channeled towards the recharge zone of the RAK aquifer system. -Next area of investigation: Seasonal wind directions & magnitude = Tasahoor -Next area: Deliver military queries such as observe deployment of military forces, weapons development, assessment of damage caused by bombs and also provide intelligence on enemy capabilities, nuclear compliance and missile launches
http://www.youtube.com/watch?v=ydbbd-4oEds&feature=fvw http://www.youtube.com/watch?v=Z_-du0dIHUE http://www.youtube.com/watch?v=v_6yeGcpoyE&feature=related Satellites are tracked by United States Space Surveillance Network (SSN), which has been tracking every object in orbit over 10 cm (3.937 inches) in diameter since it was founded in 1957. There are approximately 3,000 satellites operating in Earth orbit, according to the US National Aeronautics and Space Administration (NASA), out of roughly 8,000 man-made objects in total. In its entire history, the SSN has tracked more than 24,500 space objects orbiting Earth. The majority of these have fallen into unstable orbits and incinerated during reentry. The SSN also keeps track which piece of space junk belongs to which country. Honor, Awards Fellow Geological Society America, GSA Annual Meeting, (2009- present) Farouk El-Baz Award for Desert Research, Quaternary Geology and Geomorphology Division, Geological Society of America (1999) • Associate Editor – Geological Society America, Bulletin (2004-2007) • Research Professor – Department of Geology, University at Buffalo, Amherst, NY (2004-present). • Adjunct Associate Professor – Department of Earth and Environmental Sciences, University of Illinois, Chicago, IL (1997-present) Mohamed Sultan Professor and Chair Environmental Sciences and Remote Sensing Western Michigan University RAK Chair Professor at KSU along with Farouk El-Baz
Health Informatics: Use of Medical Data Mining to Enhance Service, Diagnosis, and Reduce Costs 1 Year, SR 55,000, Sameh, El-Affendi, Gregory (Massachusetts), Tunsi, Kassam (KFU) Comm: -Create commercial strategies for health based services/products to support new lines of health-aware businesses e.g. Mobile & Brain Health hazards, Skin Creams and skin cancer -Also builda system to reduce costs by Analyzing individual’s health care data and generate a report that describes the access spending (Gregory’s)
-Health informatics (healthcare informatics) is a discipline at the intersection of information science, computer science, and health care. It deals with resources and methods required to optimize the acquisition, storage, retrieval, and use of information in health and medical research. It is applied to the areas of medical research, clinical care, dentistry, pharmacy, nursing, and public health. -There are many Data mining Methods to be applied to healthcare information such as: Time Series Prediction, Classification, Clustering, and Association. Such algorithms can be applied to the various domain in healthcare informatics:
The specific goals of this project are to demonstrate the power of data mining in using healthcare informatics to enhance: 1 -Medical Applications: Screening, Diagnosis, Therapy, Prognosis, Monitoring, Biomedical/Biological analysis, Epidemiological studies, Hospital management, e.g. Classifying urinary stones by Cluster Analysis of ionic composition data, Efficient screening tools reduce demand on costly health care resources, Forecasting ambulance run volume, Predicting length-of-stay for incoming patients, Diagnosis and classification: e.g. ECG Interpretation, Diagnosis and classification: assist in decision making with a large number of inputs. E.g. can perform automated analysis of pathological signals (ECG, EEG, EMG), medical images (Mammograms, Ultrasound, X-ray, CT, and MRI). E.g. Heart Attacks, Chest pains, Rheumatic disorders, Myocardial ischemia using the ST-T ECG complex), Coronary artery disease using SPECT images
2 –Patient medication: Medicine revolves on pattern recognition, classification, and prediction: Diagnosis: recognize and classify patterns in multivariate patient attributes; Therapy: Select from available treatment methods, based on effectiveness, suitability to patient; Prognosis: Predict future outcomes based on previous experience and present conditions, Forecasting Patient Volume using uni-variant Time-Series Analysis, Improving Classification of multiple dermatology disorders by problem decomposition
3-Modeling Obesity in Saudi Arabian youth, Modeling the educational score in Saudi school health surveys, Better insight into medical survey data, Epidemiological studies: Study of health, disease, morbidity, injuries and mortality in human communities. E.g. Predict outbreaks in simulated populations. E.g. Assess asthma strategies in inner-city children, Discover patterns relating outcomes to exposures, Study independence or correlation between diseases, Detecting pathological conditions: e.g. tracking glucose levels, Accurate prognosis (prediction) and risk assessment for improved disease management and outcome: e.g. predict ambulation following spinal cord injury. E.g. Survival analysis for AIDS patients. Predict pre-term birth risk, determine cardiac surgical risk
Gregory Piatetsky-Shapiro, Ph.D., Research Associate Professor, Computer Science, University of Massachusetts Lowell, is widely recognized as one of the leaders in the field of data mining and knowledge discovery. He is the founder of KDD - Knowledge Discovery Conferences, a co-founder and past Chair (2005-2009) of ACM SIGKDD, (professional association on Knowledge Discovery and Data Mining), and Editor of KDnuggets.com and KDnuggets News. He has extensive experience in successfully applying data mining and business analytics to e-commerce, banking, web mining, telecom, biomedical, pharma, and other fields. Gregory worked with companies in US, Europe, and Latin America. Gregory also served as an expert witness in several cases and testified in a federal court. Gregory has over 60 publications, including 2 best-selling books and several edited collections on topics related to data mining and knowledge discovery, including SIGKDD Explorations Special Issue on Microarray Data Mining (Vol 5, Issue 2, Dec 2003). Gregory received ACM SIGKDD Service Award (2000) and IEEE ICDM Outstanding Service Award (2007) for contributions to data mining field and community.
Patient #xxx Data Sheets Patient # xxxx Data Sheets
Problem: Healthcare Costs • Healthcare costs in Saudi Arabia are sky rocketing and rising • potential problems: fraud, misuse, … • understanding where the problems are is first step to fixing them • Task: Analyze each person’s health care data and generate a report that describes the major problems
The “Key Findings Reporter”: KEFIR • KEFIR Approach: • Analyze all possible deviations • Select interesting findings • Augment key findings with: • Explanations of plausible causes • Recommendations of appropriate actions • Convert findings to a user-friendly report with text and graphics
Deviation Detection • Drill Down through the search space • Generate a finding for each measure • deviation from previous period • deviation from norm • deviation projected for next period, if no action
Interestingness of Deviations Impact: how much the deviation affects the bottom line Savings Percentage: how much of the deviation from the norm can be expected to be saved by the action
Recommendations Hierarchical recommendation rules define appropriate intervention strategies for important measures and study areas. Example: If measure = admission rate per 1000 & study_area = Inpatient admissions & percent_change > 0.10 Then Utilization review is needed in the area of admission certification. Expected Savings: 20%
Explanation A measure is explained by finding the path of related measures with the highest impact The large increase in m1 in group s1 was caused by an increase in m3, which was caused by a rise in m5 , primarily in sector s13.
Report Generation • Automatic generation of business-user-oriented reports • Natural language generation with template matching • Graphics • delivered via browser
Results of searching for Saudi Medical Data: -Acquisition of medical data for data mining algorithms is quite a difficult task, specially in Saudi Arabia. Although most of healthcare and medical facilities in KSA collect large amounts of digital data, they are hesitant to make this data available for research. As such the scope of this proposal is somewhat wide due to this fact. In this project, we have some arrangements for collecting data that we hope will eventually work. Depending on the type of data we can secure the scope of the project will focus on such area. -Following are some Saudi data that are used by CS students in the “Data Mining” course
1994 1995 1996 1995 1986 1994 1996 Forecasting Monthly Patient Volume at Family and Community Primary Healthcare Clinic of King Faisal University a Primary Health Care Clinic, Al-KhobarUsing Univariate Time-Series Analysis • Used data for 9 years to forecast volume for two years ahead 1991 Ahmed Jabreen & KamalQarawi- CS471 Error over forecasted 2 years: Mean = 0.55%, Max = 1.17%
Classifying Urinary Stones by Cluster Analysis of Ionic Composition Data Division of Urology, Department of Surgery, King Khalid University Hospitalreplayed by: hmedJabreen & KamalQarawi- CS471 • Classified 214 non-infection kidney stones into 3 groups • 9 chemical analysis variables: Concentrations of ions: CA, C, N, H, MG, and radicals: Urate, Oxalate, and Phosphate • Clustering with only the 3 radicals had 94% agreement with an empirical classification scheme developed previously at KSU, with the same 3 variables
Some International Data Sets: http://www.blackwellpublishing.com/medicine/bmj/medstats/contents.asp http://dl.dropbox.com/u/806311/911%20call.xls http://db.tt/tzTlqud http://db.tt/porTdex
Educational: The Design of Hands-on Experiments for Central/Local DBAs 1 year, SR 55,000, Sameh, Sulieman, Patrick, Khalid, Hassan, Omar Comm: Oracle Test Drive DBA Laboratory- Eng. Ibrahim El-gamlass -The intention of this project is to design and build an integrated learning environment that includes a repository of database learning materials, operational outside the local PSU/ITC laboratories. -Use of materials will also be integrated across the entire CS/IS curriculum in a more tailored form suitable for cross referencing and re-use. -Students will not only access industry based tools and applications but become custodians of their own learning/knowledge pathways through practical and hands-on experiments. -As such, these experiments will not only allow students to incorporate the knowledge learnt into more traditional CS and IS curriculum but also foster a community of interest of career opportunities in this area.
-This is a development laboratory, where the students will have full control over the machines and run CS/IS experiments on them that can have crashing consequences. The ITCS laboratories are structured for end users, and provide so little access rights to its users. -
Fourteen carefully prepared Oracle experiments; each is lasting a full week, will be prepared. Each experiment will target a specific skill of the DBA responsibilities. Each experiment will be performed exactly as if we are in a real business environment. Business and technical procedures will be strictly followed. In performing each experiment, the students will feel as if they are in real business environment, facing real technical challenges. Most of the experiments’ procedure, data, and contexts will be taken from real world situations. It will be similar to business cases in business world terminology. In each experiment, the student should follow a business procedure to report the situation (see procedure below) to appropriate authority. Fill in the required forms. Take appropriate authorization. Send system warning message to users. Estimate system down time. Then start to handle the situation. Record events in a report form, and follow the rest of the business procedure. In other words, each experiment will not only require the student to deal with a situation technically but also professionally from business context point of view. This will prepare students for the workplace.