CONTENT VALIDITY
CONTENT VALIDITY. Jeffrey M. Miller November, 2003. Origins. Content validity refers to the degree to which the content of the items reflects the content domain of interest (APA, 1954). Is the content about what we say the test is about?. Distinct or Subsumed?. Guion’s (1980) Holy Trinity

CONTENT VALIDITY
E N D
Presentation Transcript
CONTENT VALIDITY Jeffrey M. Miller November, 2003
Origins Content validity refers to the degree to which the content of the items reflects the content domain of interest (APA, 1954) Is the content about what we say the test is about?
Distinct or Subsumed? Guion’s (1980) Holy Trinity 1. Criterion-related (Predictive/Concurrent) 2. Construct 3. Criterion Cronbach (1984) / Messick (1989) – The three are different methods of inquiry subsumed by the overarching construct validity
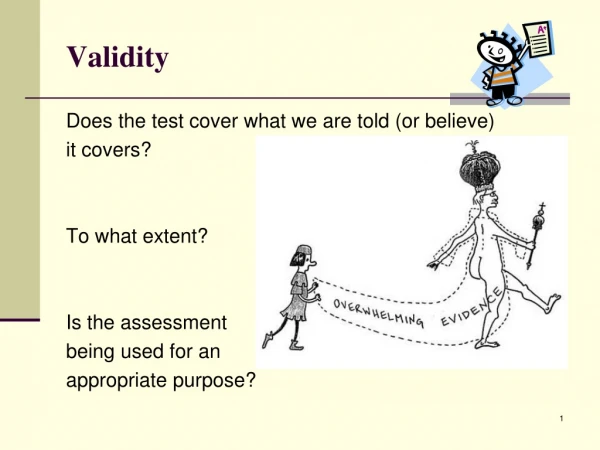
Current Definition • “Validity refers to the degree to which evidence and theory support the interpretations of test scores entailed by proposed uses of tests (AERA/APA/NCME, 1999)
So Does Content Matter??? Content is not a part of the score so it is not a part of validity (Messick, 1975; Tenopyr, 1977) Content is a feature of the test, not the score Content is a precursor to drawing a score-based inference. It is evidence-in-waiting (Shepard, 1993; Yalow & Popham, 1983)
Precursors to “Sloppy Validation”? • The overarching construct validity paradigm relegates the status of content validity and justifies poor implementation • The current definition of validity relegates the status of content validity and justifies poor implementation • Intended or unintended, what then happens to the validation of content?
Prophecy Fulfilled? “We fear that efforts to withdraw the legitimacy of content representativeness as a form of validity may, in time, substantially reduce attention to the import of content coverage (Yalow & Popham, 1983).” “Unfortunately, in many technical manuals, content representation is dealt with in a paragraph, indicating that selected panels of subject matter experts (SMEs) reviewed the test content, or mapped the items to the content standards – and all is well (Crocker, 2003)”
Recent Argument “Content representation is the only aspect of validation that can be completed prior to administering the test and reporting results. If this process yields disappointing results, there is still time to recoup” (Crocker, 2003)
The Standard Procedure • Crocker & Algina (1986) • Define the performance domain of interest • Select a panel of qualified experts in the content domain • Provide a structured framework for the process of matching items to the performance domain • Collect and summarize data from the matching process
Hambleton’s (1980) 12 Steps • Prepare and select objective or domain specifications • Clarify test’s purposes, desirable formats, number of items, instruction for writing • Write items to measure the objectives • Item writers perform the initial edit • Systematically assess item match to objectives to determine representativeness • Perform additional item editing
Hambleton’s (1980) 12 Steps • Assemble the test • Select and implement method for setting standards for interpreting performance • Administer the test • Collect data addressing reliability, validity, and norms • Prepare user’s manual / technical manual • Conduct ongoing studies relating test to different situations and populations
Beyond “The Experts Agreed” Although the procedures are explicit and detailed, ultimate assurance of content validity is based on the method on authority Our training in the importance of the scientific method may explain why “The experts agreed” doesn’t settle well. We have the quantitative item analysis, factor analysis, IRT, and Cronbach’s alpha in the same report as the qualitative expert agreement
Katz’s Percentage (1958) Using this method, experts rate whether or not the item taps the objective on a yes or no dichotomous scale Let yes =1 and no = 0 Then let n = the number of 1’s for a particular rater The proportion is simply the sum of the n’s across all raters divided by the product of the total number of items (N) and the total number of raters (J) P = sum of n / (N*J)
The obvious limitations are: • Influence by the number of items and/or raters • Dichotomous decision (hence no degree of certainty/uncertainty) • Inclusion of all items (hence no regard for individual item weighting) • No inclusion of objectives that are NOT intended to be measured and/or multiple objectives
Klein & Kosecoff’s Correlation (1975) • Experts rate the importance of the objective on a 1 to 5 point Likert scale • The mean or median is used as an index of relative importance for an item • Then, judges rate how well the item matches each objective on a yes(1)/no(0) scale. • Let p = the proportion of judges who assign a 1 to an item on one objective • Let P = the sum of the p’s for all items measuring a particular objective • Pearson’s r is then computed using the P of objective importance and the P of item to objective match
Although this technique tries to control the problem of individual item weighting via rankings of importance AND includes the possibility of multiple objectives, the limitations are • Again, sensitivity to the number of items and the number of judges • The possibility of a high r when items do not match any objective
Aiken’s V (1985) content-validity coefficient • n experts rate the degree to which the item taps an objective on a 1 to c Likert-scale • Let lo = the lowest possible validity rating (usually, this is 1 on the Likert-scale) • Let r = the rating by an expert • Let s = r – lo • Let S = the sum of s for the n raters • Aiken’s V is then V = S / [n*(c-1)] • The range will be from 0 to 1.0 • A score of 1.0 is interpreted as all raters giving the item the highest possible rating
Aiken’s V can be used with a right-tailed binomial probability table to obtain statistical significance Aiken’s V does not include 1. Objectives that are NOT intended to be measured 2. Multiple objectives
Rovinelli & Hambleton’s Index of Item-Objective Congruence (1977) • Content experts rate items regarding how well they do (or do not) tap the established objectives • The ratings are: • 1: item clearly taps objective • 0: unsure/unclear • -1: item clearly does not tap objective • Several competing objectives are provided for each item • A statistical formula (or SAS program) is then applied to the ratings of each item across raters. • The result is an index ranging from –1 to +1
An index of –1 can be interpreted as complete agreement by all experts that the item is measuring all the wrong objectives An index of +1 can be interpreted as complete agreement by all experts that the item is only measuring the correct objective
The index of item-objective congruence assumes that the item taps one and only one objective However, there is a formula (and SAS code) for situations when an item taps more than one objective.
Penfield’s (2003) Score Interval • Many of the quantification procedures address the mean rating for an item • An improvement would be to construct a confidence interval for the mean rating of an item. • We could then say that, given a mean rating of 3.42 on a 4-point Likert-scale, we are 95% certain that the true population mean rating is between 1.2 and 3.5 or that it is between 3.4 and 3.5 and determine the accuracy of expert agreement.
The traditional confidence interval assumes a normal distribution for the sample mean of a rating scale. However, the assumption of population normality can not be justified when analyzing the mean of an individual scale item because 1.) the outcomes of the items are discrete, and 2.) the items are bounded by the limits of the Likert-scale.
The Score confidence interval treats rating scale variables as outcomes of a binomial distribution. This asymmetric interval was shown to be robust to a lack of fit to a binomial distribution especially when the sample size and/or the number of scale categories is small (e.g., less than or equal to five).
Conclusion Content validity addresses the adequacy and representativeness of the items to the domain of testing purposes Content validity is not usually quantified possibly due to 1.) subsuming it within construct validity; 2.) ignoring it as important; and/or 3.) relying on accepted expert agreement procedures Indices are available, and there is a push towards improving the reporting of content validation procedures