Download
1 / 19
190 likes | 433 Views
Carbon Cycling Production of Greenhouse Gases in Livestock Operations. GASES ASSOCIATED WITH GLOBAL WARMING. Current Rate of Half % of US GHG Relative

E N D
Carbon Cycling Production of Greenhouse Gases in Livestock Operations
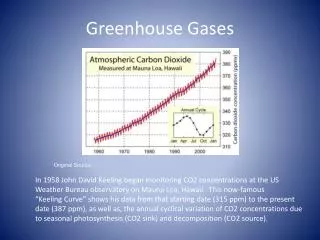
GASES ASSOCIATED WITH GLOBAL WARMING Current Rate of Half % of US GHG Relative concentration increase life GHG contribution GH effect ____Gas____(ppmV)(%/yr) _(yr)_emissions__%__( /kg)(_/mole) Carbon dioxide 360 .5 150 81 55-60 1 1 Methane 1.7 .7 7-10 10 15-20 62 22 Nitrous oxide .31 .2 150 7 5 310 310 Fluorinated hydrocarbons - - - 2 - - - Water vapor - - - - - - - • Sources • Carbon dioxide • Hydrocarbon combustion • Methane • Livestock, manure, wastewater treatment, landfills and fuel production • Nitrous oxide • Hydrocarbon combustion, industrial processes, denitrification of manure and soil N • Fluorinated hydrocarbons • Refrigeration, dry cleaning, chemical manufacturing • Water vapor • Increased temperature from other GHG
LIVESTOCK AGRICULTURE’S ROLE IN GREENHOUSE GASES Emissions Source CH4 N2O Total emissions, Tga/yr 535 17.5 Natural, Tg/yr 160 9.6 Anthropogenic, Tg/yr 375 8.0 Livestock, Tg/yr 103 6.2 Enteric, % 80 0 Manure handling, storage, 20 100 and application, % A1 Tg = 1012g *Monteny et al. 2001
GREENHOUSE GAS PRODUCTION IN LIVESTOCK • Methane • Produced by anerobic fermentation of carbohydrates in the rumen, large intestine, or stored manure • Produced by Methanogenic archea • Methanogenic archea are associated with cellulolytic bacteria and protozoa • Methane producing mechanisms • Acetate or methanol > CH4 + CO2 • CO2 + 4H2 > CH4 + H2O • Formic acid + 4H2 > CH4 + 2H2O • Effects • Greenhouse gas • Represents a loss of dietary energy • 4 to 10% of dietary gross energy in ruminant animals • 0.6 to 1.2% of dietary gross energy in swine • Increases ATP production for microbial growth
Carbohydrate fermentation • VFA and CH4 produced • from pyruvate • Net production • Glycolysis • (/ glucose) • 2 ATP • 2 NADH2 • Pentose PO4 • pathway • (/pentose) • 1.67 ATP • 2 NADPH2 • 1 NADH2 • 1 pentose ATP ATP ATP ATP ATP
Metabolism in aerobic organisms • Pyruvate • Metabolized in the tricarboxyllic acid cycle producing ATP, NADH2, FADH2 and CO2 • NADH2 and FADH2 • Oxidized in mitochondria by the electron transport system producing ATP and H2O
VOLATILE FATTY ACIDS • In animals • Absorbed through wall of the rumen in ruminants or large intestine of ruminants and nonruminants • Metabolized by the animal for energy • Main source of energy for ruminants • Provide 70% of the energy in ruminants • Production of different VFAs and methane vary with diet • Dietary factors that increase acetate production increase CH4 production • Dietary factors that increase propionate production decrease CH4 production • In manure • Volatile fatty acids contribute to manure odor • Acetic acid and propionic acid smell like vinegar • Butyric acid smells like rancid butter
Factors controlling fermentation endproducts • Maximum ATP yields for the microorganisms • Maintenance of Reduction-Oxidation balance • In glycolysis, 2 NADH2 are produced per glucose. • Must be oxidized to maintain Redox balance • Electron acceptors • Aerobic organisms • O2 > H2O • Anerobic organisms • CO2 > CH4 • Pyruvate > Propionate • Acetate > Butyrate • NO3 > NO2 > NH3 • SO4 > S
Redox balance in the rumen • 2H (Reducing equivalents) produced: • Glucose > 2 Pyruvate + 4H (as 2 NADH2) • Pyruvate + H2O > Acetate + CO2 + 2H (as 1 FADH2) • 2H accepted: • CO2 + 4H2 > CH4 + 2H2O • Pyruvate + 4H (as 2 NADH2) > Propionate + H2O • 2 Acetate + 4H (as 2 NADH2) > Butyrate + 2H2O • Fermentation balance • High forage diets • 5 Glucose > 6Acetate + Butyrate + 2Propionate + 5CO2 • + 3CH4 + 6H2O • Acetate:Propionate = 3 • CH4:Glucose = .60 • High grain diets • 3 Glucose > 2Acetate + Butyrate + 2Propionate + 3CO2 • + CH4 + 2H2O • Acetate:Propionate = 1 • CH4:Glucose = .33
FACTORS AFFECTING METHANE AND VFA PRODUCTION IN THE RUMEN OF RUMINANTS • Dietary factors • High forage levels of diet • Promotes cellulose digesting bacteria in rumen • Increases production of acetic acid and methane • Decreases production of propionic acid • High grain levels of diet • Promotes starch digesting bacteria in rumen • Increases production of propionic acid • Decreases production of acetic acid and methane • Fine grinding or pelleting of forage • Decreases the amount of time the cattle spend chewing • Decreases saliva flow and secretion of the buffer, sodium bicarbonate. • Allows rumen pH to decrease • Decreases growth of cellulolytic bacteria • Decreases production of acetic acid and methane • Increases production of propionic acid
Increasing forage maturity • Causes more chewing • Increases saliva flow and secretion of buffer, sodium bicarbonate • Increases rumen pH • Increases growth of cellulolytic bacteria • Increases production of acetic acid and methane • Decreases production of propionic acid • Feeding fats containing unsaturated fatty acids • An unsaturated fatty acid is a fatty acid that has one or more double bonds in the chain • The rumen bacteria use hydrogens to saturate (replace double bonds with hydrogens) unsaturated fatty acids • Example H H H+ H H H H H C C C C COOH H C C C C COOH H H H H H H H H Unsaturated fatty acid Saturated fatty acid • Results • Decreased acetic acid and methane production • Increased propionic acid production • Important to feed no more than 5% fat to ruminants
Feeding ionophores • Antibiotics that include • Monensin, sold as Rumensin • Lasalocid, sold as Bovatec • Increase propionic acid production • Decrease acetic acid and methane production • Production factors • Rate of gain • Regardless of diet, ruminants produce methane each day at a maintenance level • Every day the cattle or sheep is on the farm, they produce more methane • The faster an animal grows or the more milk is produced, the lower the amount of methane produced per unit of meat or milk produced
EFFECTS OF MILK PRODUCTION ON METHANE PRODUCTION/KG MILK Clemons and Ahlgrimm (2001) CH4, g/day = 59 + 4.9 kg milk/day + 1.5 BW, kg
PROJECTED IMPACTS OF USE OF CONVENTIONAL OR ORGANIC-BASED DAIRY PRODUCTION TO MEET REQUIREMENTS FOR U.S. POPULATION IN 2040 System ConventionalOrganic Milk production, kg/yr x 109 101 101 Lactating cows, x 106 6.58 8.23 Milk production, kg/cow x 103 15.3 12.3 Total dairy pop., x 106 14.0 17.5 Total land reqd, ha x 106 10.3 13.4 GHG emissions, kg/yr x 109 121 136.7 Capper et al. (2008)
ANNUAL GHG EMISSIONS FROM DIFFERENT CATTLE PRODUCTION SYSTEMS Cow-calf Cow-calfStockerFeedlot- FeedlotDairy CO2 equivalent, kg/head/yr Enteric CH4 1140 1725 743 1167 1828 Manure CH4 34 48 12 34 1075 Total CH4 1175 1773 755 1201 2903 N2O 1487 1721 1294 1490 1800 CO2 127 380 1245 252 742 Total GHG 2788 3874 3294 2944 5444 CO2 equivalent, kg/kg product Total GHG 20.6 14.4 5.7 15.5 1.1 *Phetteplace et al. (2001)
N2O PRODUCTION • Nitrification of NH3 to NO3 Nitrosomas spp. Nitrobacter spp. NH4+ NO2- NO3- • Requirements • Aerobic conditions • Warm temperatures • High C:N ratio • N2O is produced during denitrification of NO3 NO3- NO2- NO N2O N2 • Requirements • Anerobic conditions • Wet, compacted soils • Manure stacks • Warm temperatures • High C:N ratio • Amount associated with livestock production is directly related to amounts of N excreted.
FACTORS AFFECTING N2O PRODUCTION • Diet • Nonruminants • Amounts of protein fed • Increased protein = increased N excretion • Amino acid balance • Poor amino acid balance = increased N excretion • Ruminants • Amounts of protein fed • Increased protein = increased N excretion • Ratio of degraded to undegraded protein in the rumen • Increased protein degraded in rumen = increased N excretion • Ratio of degradable protein to digestible carbohydrate in the rumen • High proportion of degradable protein to digestible carbohydrate = increased N excretion • Digestible carbohydrate is needed to convert degraded NH3 into microbial protein • Amino acid balance • Poor amino acid balance = increased N excretion
Manure handling • Storage losses Anerobic Slurry Stockpiled lagoonearthen pondDeep litterCompost Relative emissions CH4 10 8 6 1 Total GHG Very high 4 2-3 1 Dominant gas CH4 CH4 CH4 & N2O N2O • Application losses • Injection > Surface application