Download
1 / 12
120 likes | 147 Views
Analyze microflare photon spectra using automated techniques for sophisticated fitting and error determination. Study thermal and non-thermal components to derive emission measures and energy distributions. Correct biases to obtain accurate results.

E N D
RHESSIMicroflare Statistics Iain Hannah, S. Christe, H. Hudson, S. Krucker, L. Fletcher & M. A. Hendry
Motivation: • Automated Spectrum Characterisation • OSPEX • Sophisticated fitting • Channel Ratios + Line Fitting • Simple • Easy to determine errors and bias • Complementary results • Microflare Statistics • Maximum Likelihood vs. Histogram Fitting • Selection Effect Bias & Correction Techniques
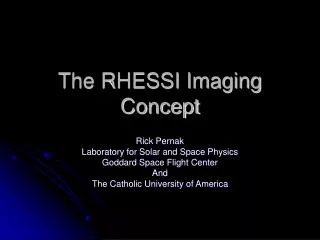
Spectrum Characterisation Counts Ratio => T Background Corrected Count Rate Microflare photon spectrum • Thermal Bremsstrahlung • Temperature T • Emission Measure EM=n2V • Non-Thermal • Power-law index γ Non-Thermal γ Thermal T, EM Photon Spectrum -Thermal Model (ph) Line Fit Remains=> γ Counts (4.67-5.67) keV ÷Thermal Model (ph->c) @ (T, 1049) => EM
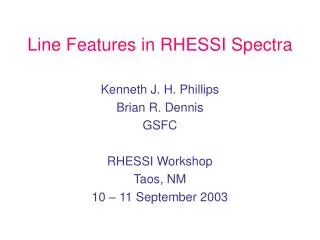
June Peak ospex ratio Key:DataTherm modelNon-therm modelTotal Model
May Peak ospex ratio Key:DataTherm modelNon-therm modelTotal Model
May Decay ospex ratio Key:DataTherm modelNon-therm modelTotal Model
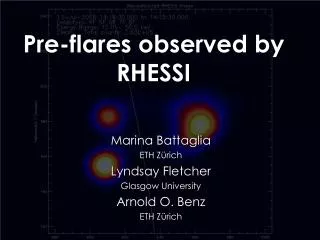
T vs EM at Peak Time Background Subtracted GOES class Dotted Line: Feldman et al [1996] Average of BCS T against EM from BCS, GOES (1-8)Å and (0.5-4)Å
OSPEX Comparison RatioOspex
Non-Thermal Energy Distribution Parnell & Jupp [2000] method is independent of bin size. So objectively fits Skew-Laplace Distribution to log(E) using approximate Maximum Likelihood method. For Total Energy only used P with error < 100%. So smaller events have underestimated energies.
Validity of Energy Distribution ? • Physical and Instrumental Bias • Malmquist like Selection effect bias • Aschwanden & Charbonneau [2002] /Parnell [2002] • Monte Carlo method of bias removal on TRACE events • We have semi-analytical way of correcting for this bias [Hendry 1990, Willick 1994]: • Valid as long as parameter scaling laws and assumption of Multivariate Normal Distribution correct: • So can numerically iterate from biased observations to intrinsic distribution (work in progress…..)