Download
1 / 32
320 likes | 357 Views
Learn about the intricate relationship between demand, supply, and price in economics, including factors influencing them and how consumers and businesses respond. Explore concepts like elasticity, equilibrium, and the impact of competition.

E N D
Relationship Between Demand, Supply and Price. Demand – the quantity of a good or service that consumers are willing and able to buy at a particular price. Law of Demand – as prices decrease, consumers buy more, as they increase consumers buy less.
There are several conditions that create a demand for a good or service: • Consumer must be interested or aware of it. • Enough of it must be available. • The price must be reasonable and competitive. • It must be accessible to the consumer.
Factors that increase or decrease demand: • Changing Consumer Income – usually an increase in income means people buy more. • Changing Consumer Tastes – people demand what is in fashion.
Changing Future Expectations – if prices are expected to increase consumers may purchase more now. • Changes in Population – more people equals more demand and as a segment of the population increases certain things increase in demand. (Seniors)
Supply – the quantity of a good or service that businesses are willing to provide at a particular price. Law of Supply – as prices decrease, producers supply less and as prices increase producers supply more.
There are several conditions that affect the supply of a good or service: • The cost of producing it. • The price consumers will pay.
Factors that increase or decreasesupply: • Change in the Number of Producers – more producers increase supply. • Changes in Prices – a price decrease will cause a reduction in supply. • Changes in Technology – reduces the cost of production and increases supply.
Changing Future Expectations – producers have to predict demand and adjust supply to it. • Changing Production Costs – lower cost resources means you can supply more goods for the same cost.
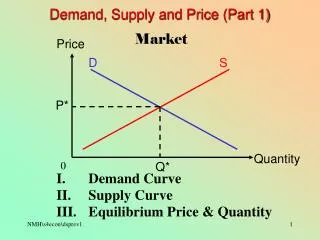
DEMAND AND SUPPLY GRAPHS Consumers buy more as prices decrease – this can be shown with a demand curve.
Suppliers provide more as prices increase - this can be shown with a supply curve.
The point at which the supply and demand curves meet is the equilibrium price. Complete supply and demand worksheet.
Price Demand 25 15 Quantity Demand • At the price of $25, the quantity demanded = 15.
Price Demand 25 10 15 30 Quantity Change in Quantity Demanded • A change in the quantity demanded is a movement along the demand curve. Caused by a price change. • When price falls to $10, the quantity demanded increases to 30.
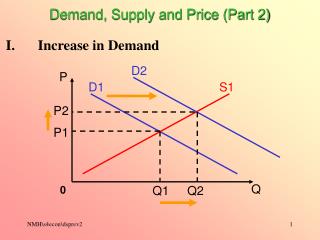
Price Demand New Demand 25 15 25 Quantity Increase in Demand • An increase in demand is a rightward shift in the entire curve. • More is demanded at every price. • At the price of $25, the quantity demanded = 25 after the increase. • Caused by something other than a price change
Price Demand 25 New Demand 10 15 Quantity Decrease in Demand • A decrease in demand is a leftward shift in the entire curve. • Less is demanded at every price • At the price of $25, the quantity demanded = 10 after the decrease.
Price Supply 25 31 Quantity Supply • At the price of $25, the quantity supplied = 31.
Price Supply 25 25 10 16 31 Quantity Change in the Quantity Supplied • A change in the quantity supplied is a movement along the supply curve. • At the price of $10, the quantity supplied = 16.
Price Supply 25 25 New Supply 31 36 Quantity Increase in Supply • An increase in supply is a rightward shift in the entire curve. • More is supplied at every price. • At the price of $25, the quantity supplied = 36 after the increase.
Price New Supply Supply 25 21 31 Quantity Decrease in Supply • A decrease in supply is a leftward shift in the entire curve. • Less is supplied at every price. • At the price of $25, the quantity supplied = 21 after the decrease.
Inelastic Demand • Quantity demanded does not respond strongly to price changes. • Necessities tend to be income inelastic. • Examples include food, fuel, clothing, utilities, and medical services.
Elastic Demand • Quantity demanded responds strongly to changes in price. • Luxuries tend to be income elastic. • Examples include sports cars, furs, and expensive foods.
Inelastic Supply • Quantity supplied does not respond strongly to price changes. • Examples include gold and tomatoes.
Elastic Supply • Quantity supplied responds strongly to changes in price. • Examples include chicken and ice-cream.
How can consumers respond to price increases for goods and services? • Purchase less. • Use a cheaper substitute. • Delay the purchase. • Do not purchase.
Competition – when two or more businesses try to sell the same type of product or service to the same customer. Direct Competition – is between similar products.
Indirect Competition – is between goods or services that are not directly related to each other.
What happens when competition enters the marketplace? • Gives consumers more choice. • May reduce prices. • Forces businesses to be more efficient. • Improves customer service. • May force businesses out of the marketplace.