Mastering Technical Analysis: History, Methods & Patterns
Discover the essence and history of technical analysis, including Dow Theory postulates. Learn about chart methods, trend indicators, and graphical patterns for effective price forecasting. Explore moving averages, oscillators, and the importance of volume in confirming trends. Gain insights into levels, trendlines, support/resistance, and graphic patterns like reversal and continuous for accurate market analysis. Uncover the power of Japanese Candlesticks and how moving averages play a crucial role in generating trading signals. Enhance your trading strategies and decision-making with proven technical analysis techniques.

Mastering Technical Analysis: History, Methods & Patterns
E N D
Presentation Transcript
Theme 7 Technical analysis Technical analysis: essence and history Dow Theory and basic postulates of the Technical analysis Methodology of the Technical analysis Graphical patterns Average analysis and trend indicators Oscillators
“If the market makes numbers out of information, one should be able to reverse the process and get information out of numbers” motto of Doyne Farmer’s prediction company
Technical analysis is a forecasting method of price movements using past prices, volume, and open interest. “The technical approach to investment is essentially a reflection of the idea that prices move in trends that are determined by the changing attitudes of investors toward a variety of economic, monetary, political, and psychological forces. The art of technical analysis, for it is an art, is to identify a trend reversal at a relatively early stage and ride on that trend until the weight of the evidence shows or proves that the trend has reversed.” Pring (2002), a leading technical analyst
Price forecasting in the technical analysis is based on previous trades. The most important results of previous trades are: - price; - volumes. TA and its postulates: 1. Movements in asset prices include all the factors. 2. Prices move directionally. 3. History repeats. Indices must confirm each other The volume of trade must confirm a trend The trend is valid for as long as there has not filed an explicit signal that it has changed
Chart methods: levels Chart methods are based on visual analysis of price dynamics. The main advantage of these methods is the ease of use. The main disadvantage is a high level of subjectivity (different technical analysts on same chart can find different patterns and make different conclusions from the analysis). Level is a price zone where interest of the market is concentrated. Their existence is based on the postulate "history repeats" and on the assumption that if the price changes direction achieving a certain price level (no matter for what reasons), then the next time it will behave in the same way, because market has a memory. There are two types of levels: support and resistance.
Level of support a price level achieving which downward trend appears to be moving in the opposite direction. On the support level long positions should be opened
Level of resistance a price level at which the uptrend begins to move in the opposite direction. On the resistance level short positions should be opened
Trendlines a graphical representation of the data changes regularity. Trendlines are used to detect and confirm the presence of directional price movement (trend). There are upward and downward trendlines.
Channels The combination of support and resistance levels used to construct the trendlines leads to an interesting method of chart analysis - channels. Channel is a special case of support and resistance lines construction when trend is present and these lines are parallel. Rules of trade in this case are similar to the rules of trading with ordinary levels: to buy from the support line and to sell from the line of resistance
Graphic patterns: reversal patterns There are two types of graphic patterns: - reversal; - continuous. Reversal patterns generate signals about possible change of trend direction. The most important patterns of this type are "head shoulders", “inverse head and shoulders", “double bottom” and “double top”, “triple bottom” and “triple top”.
Continuous patterns Contrary to reversal, continuous patterns confirm current trend and signal about the beginning of the movement actualization after a period of consolidation. The most important among continuous patterns are: triangles, flags and pennants, rectangles, etc.
Japanese Candlesticks Depending on the body size and shadows different types of Candlesticks are distinguished: “hammer”, “star”, “doji” “hanged” and others. Combinations of different types of candles can act as signals of trend reverse or continuation. Each combination has its specific, often poetic, name: “fallen star”, “two flying crows”, “morning star doji” and many others.
Moving average Moving average is an instrument of time series smoothing that gives average price values for a certain period of time. Depending on the specifics of the calculation there are several types of moving averages: - Simple Moving Average (SMA) - a calculation of a simple arithmetic average over a certain period; - Weighted Moving Average (WMA) - modified SMA with weights chosen so that recent prices have more weight than the previous ones; - Exponential Moving Average (EMA) - also uses weights, but unlike the WMA: in its calculation are involved not the previous values of prices, but the average values of these prices over time.
Moving averages and trading signals generation (dynamics of the price of gold in winter 2012, EMA with periods of 13 (thick red line) and 44 (thin blue line)
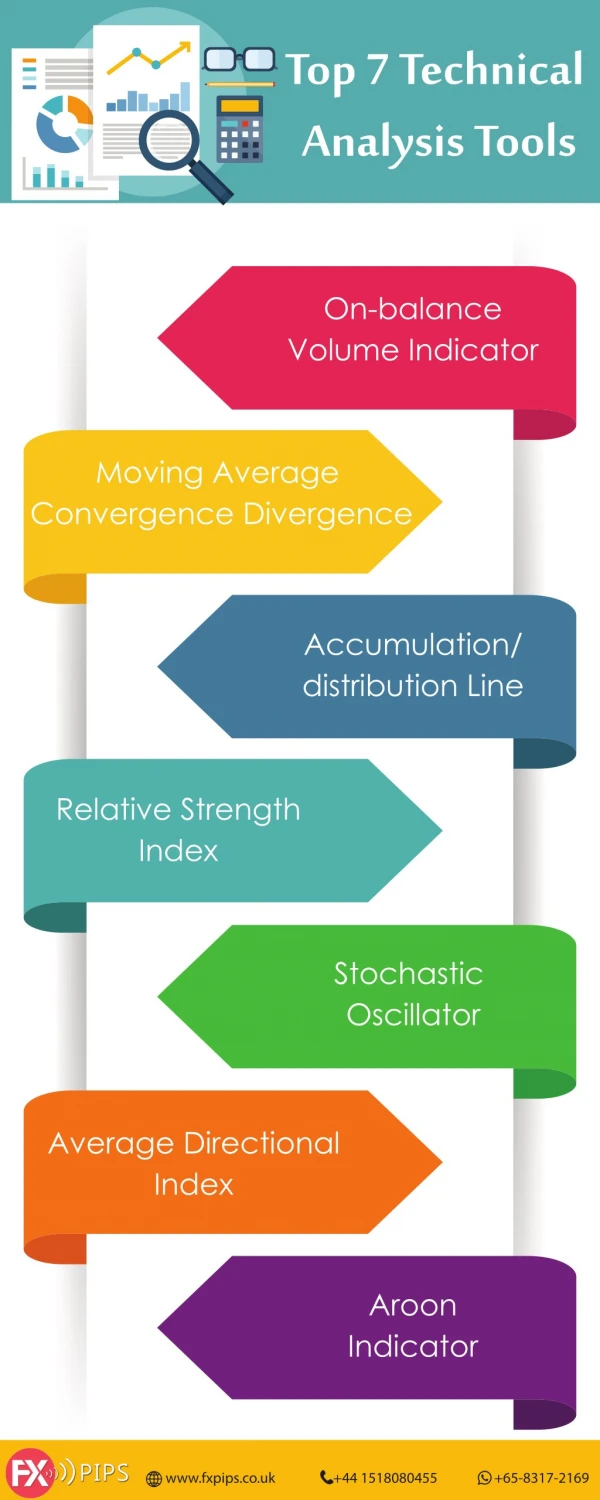
Trend indicators specific class of technical analysis indicators, designed to detect the presence and direction of trends, as well as their stage. The most commonly used trend indicators are MACD, ADX and Parabolic SAR.
Oscillators a class of technical analysis indicators that characterize the overbought / oversold conditions of the market. That helps to define the upper and lower limits range, which currently ranges price. The most commonly used indicators among oscillators are Momentum, Stochastic and Relative Strength Index (RSI).
Elliott wave theory a theory of cycles and is more developed on the theoretical than practical level. It examines patterns of cyclical fluctuations of various processes, including the movement of stock prices. In theory, knowing the phase of the cycle of movement conclusions about the future price movement can be done
The role of technical analysis in methodology of financial markets’ analysis
Critiques on technical analysis - technical analysts are always trading too late - lack of a sound statistical analysis - technical trading rules seem to be somewhat vague statements without accurately mathematically defined patterns - highly subjective nature - technical analysis is voodoo finance
Data Snooping and TA Efficiency Data snooping is the generic term of the risk that the best forecasting model found in a given data set by a certain specification search is just the result of chance instead of the result of truly superior forecasting power (see Griffioen (2004) for details). Results of strategy "Morning buy" during the first four months of 2011 In May 2011 it showed a monthly return of minus 59%, that means the loss of more than half of the deposit and nearly all the gains that have been received before. Analysis of the strategy in 2011 revealed that during the year deposit would be lost completely. A similar picture was observed in 2010
Discussion points • Japanese Candlestick Charting Techniques • William Gann and his theory of technical analysis • Fibonacci numbers • Trend indicators: calculation and interpretation • Oscillators: from the early beginning till nowadays • Elliott wave theory • Charles Dow and his theory • Eastern technical analysis • Reversal chart patterns • Continuous chart patterns
Literature • Nison, Steve, Japanese Candlestick Charting Techniques, Second Edition. • Nison, Steve, Beyond Candlesticks: New Japanese Charting Techniques Revealed • Griffioen Gerwin A. W. Technical Analysis in Financial Markets (2004) // University of Amsterdam - Faculty of Economics and Business (FEB). Access: http://papers.ssrn.com/sol3/papers.cfm?abstract_id=566882 • Technical Analysis of the Financial Markets, John J. Murphy, New York Institute of Finance, 1999 • Schwager, J. Getting Started in Technical Analysis, Wiley (February 4, 1999). - 352 pages • Technical Analysis Explained: The Successful Investor's Guide to Spotting Investment Trends and Turning Points, Martin J. Pring, McGraw Hill, 2002 • Technical Analysis of Stock Trends, 9th Edition (Hardcover), Robert D. Edwards, John Magee, W.H.C. Bassetti (Editor), American Management Association, 2007 • DeMark, Thomas R. The New Science of Technical Analysis, New York: John Wiley & Sons, 1994