Download
1 / 15
150 likes | 606 Views
The Statistical Analysis. Partitions the total variation in the data into components associated with sources of variation For a Completely Randomized Design (CRD) Treatments --- Error For a Randomized Complete Block Design (RBD) Treatments --- Blocks --- Error

E N D
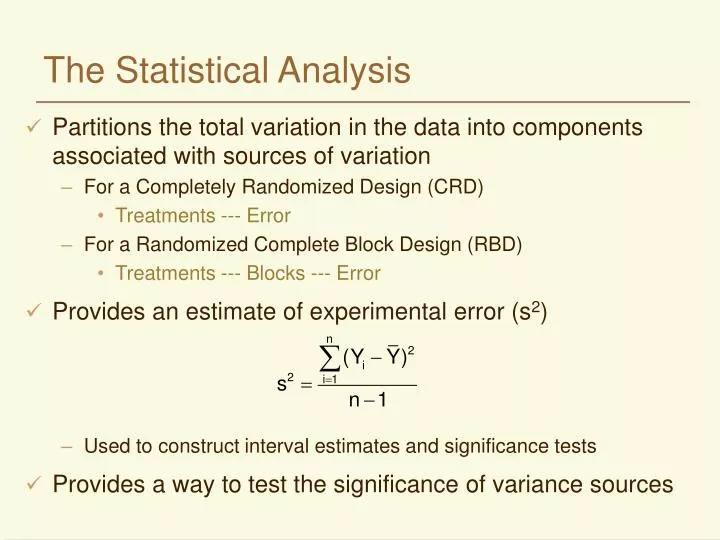
The Statistical Analysis • Partitions the total variation in the data into components associated with sources of variation • For a Completely Randomized Design (CRD) • Treatments --- Error • For a Randomized Complete Block Design (RBD) • Treatments --- Blocks --- Error • Provides an estimate of experimental error (s2) • Used to construct interval estimates and significance tests • Provides a way to test the significance of variance sources
mean Yij = + i + ij observation random error treatment effect Analysis of Variance (ANOVA) Assumptions • The error terms are… randomly, independently, and normallydistributed, with a mean of zero and a common variance. • The main effects are additive Linear additive model for a Completely Randomized Design (CRD)
The CRD Analysis We can: • Estimate the treatment means • Estimate the standard error of a treatment mean • Test the significance of differences among the treatment means
SiSj Yij=Y.. What? • i represents the treatment number (varies from 1 to t=3) • j represents the replication number (varies from 1 to r=4) • S is the symbol for summation Treatment (i) Replication (j) Observation (Yij) 1 1 47.9 1 2 50.6 1 3 43.5 1 4 42.6 2 1 62.8 2 2 50.9 2 3 61.8 2 4 49.1 3 1 66.4 3 2 60.6 3 3 64.0 3 4 64.0
grand mean mean of the i-th treatment deviation of the i-th treatment mean from the grand mean The CRD Analysis - How To: • Set up a table of observations and compute the treatment means and deviations
The CRD Analysis, cont’d. • Separate sources of variation • Variation between treatments • Variation within treatments (error) • Compute degrees of freedom (df) • 1 less than the number of observations • total df = N-1 • treatment df = t-1 • error df = N-t or t(r-1) if each treatment has the same r
The CRD Analysis, cont’d. • Compute Sums of Squares • Total • Treatment • Error SSE = SSTot - SST • Compute mean squares • Treatment MST = SST / (t-1) • Error MSE = SSE / (N-t) • Calculate F statistic for treatments • FT = MST/MSE
Using the ANOVA • Use FT to judge whether treatment means differ significantly • If FT is greater than F in the table, then differences are significant • MSE = s2 or the sample estimate of the experimental error • Used to compute standard errors and interval estimates • Standard Error of a treatment mean • Standard Error of the difference between two means
Numerical Example • A set of on-farm demonstration plots were located throughout an agricultural district. A single plot was located within a lentil field on each of 20 farms in the district. • Each plot was fertilized and treated to control weevils and weeds. • A portion of each plot was harvested for yield and the farms were classified by soil type. • A CRD analysis was used to see if there were yield differences due to soil type.
1 2 3 4 5 42.2 28.4 18.8 41.5 33.0 34.9 28.0 19.5 36.3 26.0 29.7 22.8 13.1 31.7 30.6 18.5 10.1 31.0 19.4 28.2 Mean Mean 35.60 23.42 15.38 33.74 29.87 27.18 ri 3 5 4 5 3 20 Dev 8.42 -3.77 -11.81 6.55 2.68 Table of observations, means, and deviations
Source df SS MS F Total 19 1,439.2055 Soil Type 4 1,077.6313 269.4078 11.18** Error 15 361.5742 24.1049 ANOVA Table Fcritical(α=0.05; 4,15 df) = 3.06 ** Significant at the 1% level
Formulae and Computations Coefficient of Variation Standard Error of a Mean Confidence Interval Estimate of a Mean (soil type 4) Standard Error of the Difference between Two Means (soils 1 and 2) Test statistic with N-t df
Mean Yields and Standard Errors Soil Type 1 2 3 4 5 Mean Yield 35.60 23.42 15.38 33.74 29.87 Replications 3 5 4 5 3 Standard error 2.83 2.20 2.45 2.20 2.83 CV = 18.1% 95% interval estimate of soil type 4 = 33.74 + 4.69 Standard error of difference between 1 and 2 = 3.58
1 2 4 5 3 Report of Analysis • Analysis of yield data indicates highly significant differences in yield among the five soil types • Soil type 1 produces the highest yield of lentil seed, though not significantly different from type 4 • Soil type 3 is clearly inferior to the others


