Download
1 / 17
170 likes | 355 Views
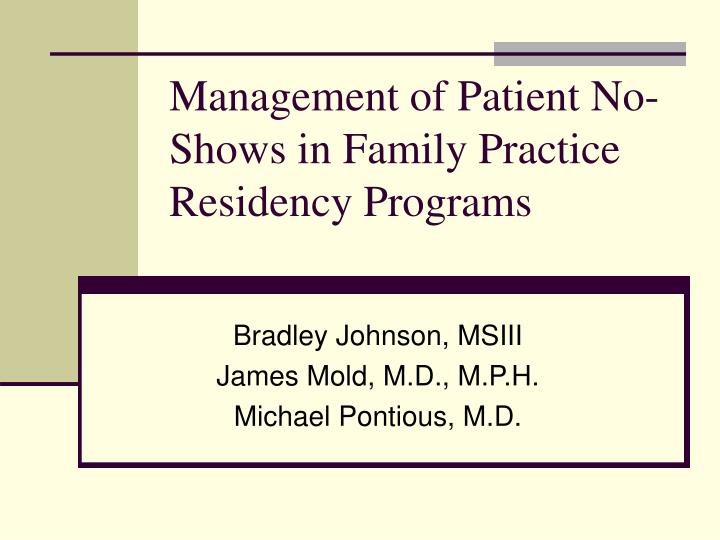
Management of Patient No-Shows in Family Practice Residency Programs. Bradley Johnson, MSIII James Mold, M.D., M.P.H. Michael Pontious, M.D. Research Question. What is the best way to reduce no-shows in residency clinics? What it the best way to manage no-shows that do occur?. Methods.

E N D
Management of Patient No-Shows in Family Practice Residency Programs Bradley Johnson, MSIII James Mold, M.D., M.P.H. Michael Pontious, M.D.
Research Question • What is the best way to reduce no-shows in residency clinics? • What it the best way to manage no-shows that do occur?
Methods • Survey directors of all U.S. family practice residency clinics • Find exemplary clinics for each of the two steps/components • Interview (phone) medical directors/managers of exemplary clinics • Identify a combined “best” method for managing no-shows
Methods Definition of “best” methods • Clinics with the lowest no-show rates for resident appointments (<10%) 2) Clinics seeing 8-10 patients/resident/half day and a satisfaction level of 4-5 for current management technique
Methods Survey Instrument • Clinic demographics • Average number of visits/half day/resident for: • established patients • new patients • no-shows
Methods • Perception of no-show problem • Satisfaction with current methods • Current methods in use • Impact of no-shows
Frequency of No-Show Rates Mean 20.5%
Correlations • No correlation between no-show rates and satisfaction with no-show rates • No correlation between no-show rates and percentage of Medicaid patients • Negative correlation between no-show rate and number of patients seen/half-day • Positive correlation between number of patients seen/half-day and satisfaction with management of no-shows once they have occurred
Top 10 Clinics for No-Show Rate • No-Show Rate - Range: 3 - 9% - Mean: 6.3% • Satisfaction with Method to Reduce No-shows - Range: 1 - 5 - Mean: 3 • Prevention Method 7 - reminder calls to all patients 1 - reminder calls to problem patients only 1 – nothing
Bottom 10 Clinics for No-Show Rate • No-Show Rate - Range: 33 - 57% - Mean: 43.3% • Satisfaction with Method to Reduce No-shows - Range: 1 - 4 - Mean: 2.3 • Prevention Method 4 - reminder calls to patients 2- sometimes make reminder calls to patients 2 - patient education 1 - reminder letter 1- letter 10 days, call 1& 2 days before
Top 10 Clinics for Visits/half day of 8-10 and No-Show Management Satisfaction of 4 or 5 • No-Show Rate - Range: 10-30% - Mean: 14.6% • Management Method 3 - fill with walk-ins 1 – overbook (3 - send warning letters, dismiss from practice after 3 no-shows 3 - send letters)
Bottom 10 Clinics for Visits/half day of 8-10 and No-Show Management Satisfaction of 1 or 2 • No-Show Rate - Range: 12-38% - Mean: 12.8% • Management Method (3 - send letters 2 - send warning letters, possibly dismiss from practice after 3 no-shows 2 - nothing 1 - send letters, after 3 no-shows patient asked to come in at end of schedule and is worked in 1 - patient education)
Interviews to Date 4 Interviews with managers of clinics with low no-show rates • 1 actually has rate of 14-15% (disqualified) • The other 3 call EVERY patient the day before, record ALL no-shows and cancellations in chart; send policy letter after first no-show; dismiss patients after 3-in-a-row