Download
1 / 44
440 likes | 531 Views
Explore viral proteins and their resemblance to host proteins using a bioinformatics project. Phase I: VirOsNet tools for evolutionary analysis. Phase II: Codon usage analysis for virus-host classification. Discover virus theft and mimicry, evolutionary tracking, and potential drug targets.

E N D
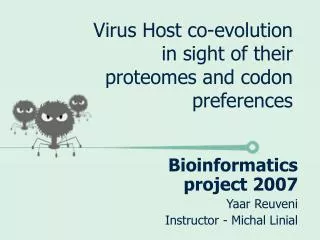
Virus Host co-evolution in sight of their proteomes and codon preferences Bioinformatics project 2007 Yaar Reuveni Instructor - Michal Linial
Outline: My project is composed of two phases: • Phase I: The virus host web tool – VirOsNet. You are welcome to visit at: www.virosnet.cs.huji.ac.il • Phase II: Virus Host co-evolution research using codon usage analysis.
Viruses: • Basically a cpasid envelope that contains genetic information. • Viruses can not replicate by themselves, and depend on the host for reproduction. • It’s main purpose in life enter a host, and use it’s facilities to reproduce
Phase I: VirOsNet VirOsNet provides database and tools for exploring virus evolution and virus-host co-evolution
Background and Motivation: • Ample of examples suggest that often viruses steal information from their hosts. • Viruses must optimize their amount of genetic material and physical size. • Viruses have very fast evolution: • Hard to trace. • Might change by switching hosts. • Shuffle their genetic material.
Phase (I) main objective: Compare all viral proteins to all known proteins and detect resemblance. Meaning: in what way do viral proteins "resemble" any of all other known proteins in our world?
Objectives and possible outcomes (i) • Clever search: Provide crossbreeding factors when searching • Offer comparisons of viruses relative to the proteome of their known hosts • Stolen elements: where were they stolen from? Was it from the host? • Mimicking phenomenon: detect host - protein mimicry • When did it happen: Evolutionary tracking
Objectives and possible outcomes (ii) • Recent event – indicative by similarity search results that are exceptional. • Insights on viruses and their proteomes. Long term: • Pharmaceutics applications. Proposal of drug targets
Methods: • Data is from the ProtoNet DB (currently ~ 1.8 million proteins) All proteins are from UniProt. • New tables to the DB -specialized for host-virus relations. • Pre computed BLAST (BLOSUM62) and dynamic BLAST options. • Entry is a Viral Protein, BLAST search results are sorted by the descending E-values. • Several display schemes. • Each result associated with domain information (InterPro) • Download options for next phase analysis
Tool overview: The tool works in a 4 steps scheme: • Step 1: search for a virus to query on using one of the search methods • Step 2: choose a specific virus • Step 3: choose one of it’s proteins, and the BLAST properties • Step 4: choosing one of the BLAST results to get it’s pairwise alignment
Some Statistics Entry point to viruses according to their genetic material complexity
Example: check all dsRNA viruses Affecting Eukaryotes
Case study: • Abelson murine leukemia virus: a VERY close homolog of human and a mouse protein tyrosine kinase that: • Regulates cytoskeleton during cell differentiation, cell division and cell adhesion • Regulates DNA repair potentially in severe demage. The viral protein causes cancer(active site mutation) Lets look at it……
Summery Phase I: • Pros: • Platform for studying viruses relative to hosts • A discovery tool • Rich BLAST options for evolutionary wider view • Crossbreeding with host data (i.e. IntrPro Domains). • Dynamic view on BLAST result as a group (ProtoMesh) • Cons: • Still to improve the usability to the average biologist • VirOsNet can get very slow on overload or in some of the filtering options.
Phase II: Codon usage Figure adapted from L. Merkel, N. Budisa, BIOspektrum 2006 , 12 , 41. Veränderung des genetischen Codes. Virus-host classification using codon usage analysis with SVM
Main question: Given a viral protein, determine who might be a potential host of the virus. The basis for the hypothesis: An optimization of the viruses toward their hosts
Objectives: • Create a classification tool, that receives a viral protein and will give a prediction on its potential hosts. • Classify all the proteins to different classes, using a maximum-margin hyperplane. • Provide different levels of classification. • Create a “host rank” for a given viral protein for each of its potential hosts. • Results: May suggest a “virus cross-species potential index”
Methods: • Collect and arrange all the codon usage data (or other relevant data for this classification). • Analyze the data, normalization and processing. • Unsupervised learning and clustering for better understanding of the data. • Given all codon usage for all species, use the SVM algorithm to create a predictor for a new specimens. • Provide various levels of classifying classes for the codon data.
Codon usage species 1 . . . 64 About the data: • Codon usage is calculated for each species. • Each species is represented by a 64 positions vector. • The question of normalization: • standard normalize to 1. • functional per amino-acid, or by entropy. • percentage – per column
Data from Nakamura: • Codon usage tabulated from the international DNA sequence databases Nakamura, Y., Gojobori, T. and Ikemura, T. (2000) Nucl. Acids Res. 28, 292. • Downloading the codon usage table • The data covers all species (including viruses).
Usage distribution: Primates Bacteria Invertebrates Plants Rodents Viral
Usage distribution: Positions 1-13
Our data: • It was expected to find diverse codon usage between different taxonomy groups. • There are 703 distinct known hosts in our DB and 2152 distinct known hosted viruses. • I created an interface for extracting the CDS data from the coding data we have in ProtoNet. • I used the same convention for the vector
In ProtoNet (version 5.1): 16,567 viruses and 409,726 proteins
7 Rodents Fungi 2 302 112 32 647 Plants Primates 6 0 137 151 226 Aves 308 70 Bacteria Tetrapoda Fish Arthropoda 16 (+99) distributed Who infect what? 6 Others
Comparison: Positions 1-12 Looks Promising!
Clustering: • preliminary results • Using a set of COMPACT tool (COMPACT: A Comparative Package for Clustering Assessment) • Varshavsky et al, 2005 ISPA: 159-167. Visualization of results Scoring
Summery phase II: • All data is organized, accessible and will update along with the ProtoNet DB. • Comprehensive analysis, created a good understanding of the data. • Future plans: • Decide on a good division into classes. • Use SVM algorithm to create a classifier, given a virus codon preferences guess potential hosts. • Create an interface that offers this service.
Acknowledgements: Thank you to all the people that helped: • Michal Linial • Iris Bahir • Menachem Fromer • Alexander Savenok • Michael Dvorkin • Roy Varshavsky