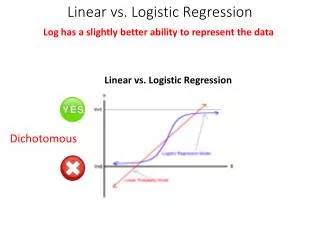
Comparing Logit Model, Logistic Regression, and Log-Linear Model in Leaving Home Studies
340 likes | 470 Views
Explore the differences and applications of logit model, logistic regression, and log-linear model in studies related to leaving home. Analyzing models of counts with a focus on time, sex, and their interactions. Examining political attitudes and voting behaviors based on gender using descriptive statistics and logistic regression. Understand the relationship between logit and log-linear models and their implications in predicting the likelihood of leaving parental home early or late. Implementing different coding methods for variables such as sex and party in logistic regression and conducting analyses using SPSS software.

Comparing Logit Model, Logistic Regression, and Log-Linear Model in Leaving Home Studies
E N D
Presentation Transcript
C. Logit model, logistic regression, and log-linear model A comparison
Leaving home Models of counts: log-linear model
Leaving home Model 3: Time and Sex (unsaturated log-linear model) 11 = exp[4.697] = 109.6 21 = exp[4.697 + 0.4291] = 168.4 12 = exp[4.697 - 0.0982] = 99.4 22 = exp[4.697 + 0.4291 - 0.0982] = 152.8
Leaving home • Model 4: TIME AND SEX AND TIME*SEX interaction 11 = exp[4.905 = 135 21 = exp[4.905 + 0.0576] = 143 12 = exp[4.905 - 0.6012] = 74 22 = exp[4.905 + 0.0576 - 0.6012 + 0.8201] = 178
Political attitudes Log-linear model: Select one variable as a dependent variable: response variable, e.g. does voting behaviour differ by sex Are females more likely to vote conservative than males? Logit model:
Political attitudes Are females more likely to vote conservative than males? A = Party; B = Sex Effect coding (1) Males voting conservative rather than labour: Log-odds = logit Females voting conservative rather than labour:
Political attitudes Are women more conservative than men? Do women vote more conservative than men? The odds ratio. If the odds ratio is positive, then the odds of voting conservative rather than labour is larger for women than men. In that case, women vote more conservative than men. Logit model: with x = 0, 1 with a = Log odds of reference category (males) and b = Log odds ratio (odds females / odds males)
Select a response variable proportion • Dependent variable of logit model is the log of (odds of) being in one category rather than in another. • Number of observations in each subpopulation (males, females) is assumed to be fixed. • Intercept (a) = log odds of reference category • Slope (b) = log odds ratio
Political attitudes Logit model: descriptive statistics Counts in terms of odds and odds ratio DATA Sex Party Male Female Total Conservative 279 352 631 Labour 335 291 626 Total 614 643 1257 Reference categories: Labour; Males F11 = 279 F21 = 335 = 279 * 335/279 = 279 / 0.8328 F12 = 352 = 279 * 352/279 = 279 1.2616 F22 = 291 = 279 * 352/279 * 291/352 = 279 * 1.2616 * [1/1.2096]
Political attitudes Logistic regression SPSS Reference category: females (X = 1 for males and X = 0 for females) Variable Param S.E. Exp(param) SEX(1) .3732 .1133 1.4524 Constant -.1903 .0792 Females voting labour: 1/[1+exp[-(-0.1903)]] = 45% 291/626 (females ref.cat) Males voting labour: 1/[1+exp[-(-0.1903+0.3732)]] = 55% 335/626 Different parameter coding: X = -0.5 for males and X = 0.5 for females Variable Param S.E. Exp(param) SEX(1) -.3732 .1133 0.6885 Constant -.0037 .0567 Females voting labour: 1/[1+exp[-(-0.0037 + 0.5*(-0.3732))]] = 45% 291/626 Males voting labour: 1/[1+exp[-(-0.0037 - 0.5 * (-0.3732))]] = 55% 335/626
Observation from a binomial distribution with parameter p and index m The logit model and the logistic regression Leaving parental home
Leaving home Relation logit and log-linear modelThe unsaturated model Log-linear model: With i effect of timing and j effect of sex Odds of leaving parental home late rather than early: females:
Leaving home Relation logit and log-linear modelThe unsaturated model Odds of leaving parental home late rather than early: males:
Leaving home Relation logit and log-linear modelThe saturated model Log-linear model: With i effect of timing and j effect of sex and ij the effect of interaction between timing and sex Odds of leaving parental home late rather than early: females (ref):
Leaving home Relation logit and log-linear modelThe saturated model Odds of leaving parental home late rather than early: males:
Leaving home Logit model: X=0 for males X=1 for females Logistic regression: probability of leaving home late
Leaving home Dummy coding: ref.cat: females, late Effect coding or marginal coding: females +1; males –1
The logistic regression in SPSS Micro data and tabulated data
SPSS: Micro-data • Micro-data: age at leaving home in months • Crosstabs: Number leaving home by reason (row) and sex (column) • Create variable: Age in years • Age = TRUNC[(month-1)/12] • Create variable: TIMING2 based on MONTH: • TIMING2 =1 (early) if month 240 & reason < 4 • TIMING2 =2 (late) if month > 240 & reason < 4 • For analysis: select cases that are NOT censored: SELECT CASES with reason < 4
SPSS: tabulated data • Number of observations: WEIGHT cases (in data) • No difference between model for tabulated data and micro-data
Leaving home The logistic regression in SPSS
Related models • Poisson distribution: counts have Poisson distribution (total number not fixed) • Poisson regression • Log-linear model: model of count data (log of counts) • Binomial and multinomial distributions: counts follow multinomial distribution (total number is fixed) • Logit model: model of proportions [and odds (log of odds)] • Logistic regression • Log-rate model: log-linear model with OFFSET (constant term) Parameters of these models are related