Download
1 / 34
340 likes | 504 Views
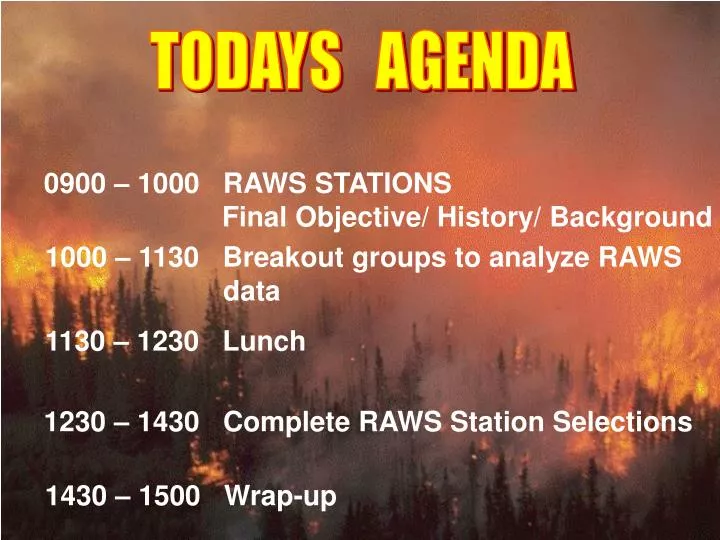
0900 – 1000 RAWS STATIONS Final Objective/ History/ Background. 1000 – 1130 Breakout groups to analyze RAWS data. 1130 – 1230 Lunch. 1230 – 1430 Complete RAWS Station Selections. 1430 – 1500 Wrap-up. TODAYS AGENDA. FINAL OBJECTIVE.

E N D
0900 – 1000 RAWS STATIONS Final Objective/ History/ Background 1000 – 1130 Breakout groups to analyze RAWS data 1130 – 1230 Lunch 1230 – 1430 Complete RAWS Station Selections 1430 – 1500 Wrap-up TODAYS AGENDA
FINAL OBJECTIVE MAKE A PRIORITIZED LIST OF RAWS STATIONS WHICH REPRESENT LARGE SCALE CLIMATIC ZONES FOR USE AS PART OF THE NATIONAL RAWS AND AUTOMATED NFDRS SYSTEMS.
WHAT WE WANT TO DO TODAY… • SELECT RAWS WEATHER STATIONS WHICH • WILL BE PRIORITY SITES • MAINTAINED TO ALL NFDRS STANDARDS • PURCHASE THE LATEST HARDWARE AND SOFTWARE • ENSURE MINIMUM DOWN TIME DURING FIRE SEASON • REPORTING TIMES NEAR 2PM • ANNUAL VEGETATION CONTROL AND SITE MAINT. • SEND RAWS STATION LIST TO PNWCG STEERING • COMMITTEE
WHAT WE ARE NOT GOING TO DO TODAY… • FOCUS ON NON-RAWS OR LOCAL WEATHER • STATIONS USED FOR • FORECASTS • IFPLS • SMOKE MANAGEMENT • SPOT FORECASTS
CURRENT PNWCG WWT MEMBERS PAST MEMBERS AND TASK GROUPS Roddy Baumann US Fish and Wildlife Service 911 NE 11th Avenue Portland, Oregon 97232-4181 Phone: 503-231-2075 Fax: 503-231-2364 Email: Roddy_Baumann@r1.fws.gov Gene Lonning Bureau of Indian Affairs 911 NE 11th Ave Portland , Oregon 97232 Phone: 503- 231-6761 Fax: 503-231-6774 Email: glonning@bia.gov Tom Nichols National Park Service 600 Harrison Street Suite 600 San Francisco, California 94107 Phone: 415-427-1371 Fax: 415-427-1487 Email: Tom_Nichols@nps.gov Greg Sinnett Washington Dept of Natural Resources PO Box 47037 Olympia, Washington 98504-7037 Phone: 360-902-1328 Fax: 360-902-1781 Email: Greg.Sinnett@wadnr.gov Gerry DayNorthwest Int Coordination Center 5420 NE Marine Dr Portland, Oregon 97218-1089 Phone: 503-808-2732 Fax: 503-808-2750 Email: Gerry_Day@or.blm.gov Jim Brain US Forest Service Retired? Paul Werth Northwest Interagency Coordination Center 5420 NE Marine Dr Portland, Oregon 97218-1089 Phone: 503-808-2737 Fax: 503-808-2750 Email: pwerth@fs.fed.us Mike Ziolko, Chair Oregon Department of Forestry 2600 State Street Salem, Oregon 97310 Phone: 503-945-7452 Fax: 503-945-7454 Email: MZiolko@odf.state.or.us Terry Marsha National Weather Service Portland Fire Weather Office
WEATHER STATION ANALYSIS HISTORY MID 1990’S EFFORTS WERE MADE TO ESTABLISH WEATHER STATION NEEDS. 1996 – A USER SURVEY WAS COMPLETED BY PNWCG MEMBERS AND THE FIRE WEATHER OFFICES. 1997-PRESENT - NWS MAR CHANGES CAUSED WEATHER WORKING TEAM TO FOCUS ON FIRE WEATHER IMPACTS. 2000-PRESENT - JIM BRAIN AND TERRY MARSHA WORKED ON SEPARATE APPROACHES TO ANALYZE WEATHER STATIONS.
HISTORY /BACKGROUND JIM BRAIN’S ANALYSIS • 1996 SURVEY • NFDRS STUDY • NFDRS STATION STANDARDS • ALL WEATHER STATIONS STATEWIDE WERE ANALYZED • FIRE FAMILY PLUS PROGRAM USING WIMS DATA • WEATHER STATION COSTS, DATA QUALITY, ASCAD DATA • MAINTENANCE, HARDWARE, SITE PROBLEMS
Basic Station Data—This information came from the WIMS station catalogs, ASCAD data base and NWS operating plans. It is basic station data.
Observations available in NIFMID— This data was developed from the observations that he downloaded from the NIFMID data base into FireFamily Plus. Blanks represent obviously no data was available for that year. It should be noted that this is data available in NIFMID and may not represent the data that was available at 1300 LST to the NWS as several units do not enter their data until later in the day. The maximum number of observations per year is 123. 90% data availability=111 observations per year. 80% data availability= 99 observations per year. Information, in 1992, lost during the conversion from AFFIRMS to WIMS.
Comparison of Burning Index (BI) and Energy Release Component (ERC) values— What is displayed here are the 25th, 50th, 75th and 90th percentile values for each of the NFDRS elements. In other words, the value displayed under the 90th column indicates that 90% of the time the NFDRS value is equal to or less than that value. The purpose for displaying the four different values isto demonstrate that the frequency distribution pattern often varies by station and that the traditional way of comparing stations using the 90th percentile values may not tell the whole story.
Comparison of Weather Elements—What is displayed here is the 25th, 50th and 75th percentile values for RH and Temperature. In addition the mean monthly wind speed for July, August and September are shown as is the percentage of the observation days without measurable precipitation. The annual precipitation and station elevation figures are from the WIMS catalog information and are included to help explain possible causes for variation within the weather zones.
HISTORY /BACKGROUND TERRY MARSHA’S ANALYSIS Goal:Define an objective method that could be used to create a more efficient RAWS network that adequately meets the needs of land/fire managers while reducing needless redundancy. Primary regard is given to NFDRS and forecasting for fire weather and smoke management. Given: A network of approximately 200 RAWS currently exists in Washington and Oregon.
Assumptions: • The current network of RAWS adequately represents • the weather of the PacNW. • 2. Within the current network of RAWS exists a smaller • subset of RAWS that is equally representative. • This analysis is comprised of two parts. • First a wind rating is determined for each RAWS in the • analysis. • Secondly, a cross correlation matrix of the daily • minimum afternoon relative humidity of the RAWS • within a particular area is developed. The results of • these two tools provides the means for determining • the final RAWS network.
Wind Rating: The purpose of the wind rating is to objectively assess the wind characteristics of each RAWS in order to try and ensure that as many as possible of the RAWS in the final network are wind sensitive. A “good” wind sensitive RAWS should show an ability to respond with elevated wind speeds when the weather dictates and also show good variability. These characteristics can be determined by inspection of the distribution of the RAWS’s hourly wind speed.
Procedure: Start with a database of hourly weather observations for all RAWS covering several summers. For each day the peak wind speed is determined for each of six “4-hour” time periods covering the full 24 hours of the day. This is done for each RAWS in the network analysis. A “climatological” distribution of the peak wind speed for each “4-hour” time period for each RAWS is generated and the median and 90th percentile value of the peak wind speed is determined for each time period. A “spread statistic” is defined as: (90th percentile peak WS) – (median peak WS) / (median peak WS) This statistic indicates the amount of variability in the RAWS’s wind speed frequency distribution (much like the standard deviation).
From the value of the 90th percentile peak WS and the “spread • statistic” defined above, the wind sensitivity rating for each • “4-hour” time period is determined for each RAWS using the • following criteria. • a. 90th percentile peak WS ≥ 10 mph during a “4-hour” time period • b.“spread statistic” for the same time period ≥ .50 • The above criteria indicates adequate or better wind sensitivity.
Wind ratings are determined as follows: RATING 0 - if the above criteria were not met for any of the six “4-hour” time periods of the day 1 - if the above criteria were met for at least 1 “4-hour” time period of the day 2 - if the above criteria were met for at least 1 daytime and 1 nighttime “4-hour” time period A wind rating of : 0 is considered “inadequate” ; 1 is “adequate” ; 2 is “good”. Effort should be made to ensure that as many of the RAWS as possible in the final network have a wind rating of 1 or 2.
RH Correlation Analysis: After the wind sensitivity rating is determined for each RAWS, the cross-correlation analysis of the daily minimum relative humidities of the RAWS can be done. This is the main analysis for determining the “key” RAWS making up the final network. *note…Daily minimum RH is a good element to use for determining similarity between RAWS but one could experiment with other elements as well such as some NFDRS index or component.
Procedure: Start with a database of daily afternoon minimum RH’s for all RAWS in your analysis. Correlate the minimum daily RH of each RAWS with the corresponding minimum RH of all other RAWS in your analysis. This results in a cross-correlation matrix showing how each individual RAWS correlates with every other RAWS in your Analysis in terms of daily afternoon minimum RH. Select from your cross-correlation matrix the RAWS with the most correlations at or above a chosen threshold and designate as RAWS 1.
I have found that for RH, a correlation coefficient threshold of around .90 is a good choice but really depends on the area being analyzed. If you desire more stations in your network select a higher threshold ( ie .92 ) or if you want less key stations, choose a lower threshold. Remove from your analysis RAWS 1 and all the other RAWS that correlate with it at your threshold value or higher. Remove from your analysis RAWS 1 and all the other RAWS that correlate with it at your threshold value or higher. From the remaining RAWS, repeat step 2 and and designate as RAWS 2. Again remove RAWS 2 and all those that correlate with it at your threshold value or higher. Continue repeating steps 2 through 4 until either no stations remain or none of the remaining stations correlate with another at your threshold value or greater.
What you are left with is a subset of “KEY RAWS” that are uniquely different from one another as defined by your selection of a correlation coefficient threshold. All other RAWS may be discarded from your network because they correlate highly with at least one of the Key RAWS. You will find as you proceed through this analysis that often you may have a “tie” between several RAWS and need to make a choice on which to pick as a “key”. In such instances, I would recommend placing high priority on stations having a wind rating of a 1 or 2.
WESTERN WASHINGTON RAWS SITES Area 1 - Olympics Area 2 - Coastal Area 3 – W Washington Cascades Area 4 – NW Oregon Cascades Area 5 – SW Oregon Area 6 – NE Washington Mtns Area 7 – Central Washington Area 8 – N Central Oregon Area 9 – S Central Oregon Area 10 – Blue Mtns Area 11 – SE Oregon
PROPOSED RAWS SITES
PNWCG WEATHER WORKING WEBSITE…
OTHER WEATHER SITES TO RESEARCH…