Download

1 / 16
160 likes | 296 Views
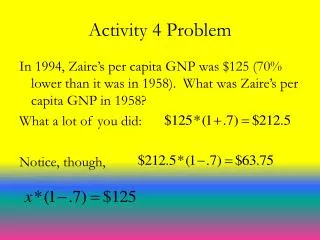
Be a weather presenter Activity 4. Extreme weather images Cyclone Yasi – 3 February 2011 Category 5 cyclone. Source: BOM. Extreme weather images Victorian floods – 3 September 2010. Source: BOM. Weather maps Illustrates the meteorological conditions of an area at a specific time

E N D
Be a weather presenter Activity 4
Extreme weather images Cyclone Yasi – 3 February 2011 Category 5 cyclone Source: BOM
Extreme weather images Victorian floods – 3 September 2010 Source: BOM
Weather maps • Illustrates the meteorological conditions of an area at a specific time • Shows what the weather is currently doing • Shows what type of weather is expected during the hours and days ahead Source: BOM
How to read a weather map • H = high pressure, L = low pressure • Isobars are labeled with a number = air pressure (hectopascals) • Air pressure is higher near the centre of a high pressure weather system • Air pressure is lower near the centre of a low pressure system • Isobars that are closely spaced mean strong winds (low pressure systems) • Isobars that are spaced far apart indicate calm weather (high pressure systems)
Rainfall Text Text Calm, light winds High pressure system Strong winds Low pressure system
What to do: Weather map • In pairs, choose a weather map • Save the image • Annotate and locate the following features: • High pressure system • Low pressure system • Air pressure • Strong winds • Light winds • What is the expected weather at your current location (include rainfall)?
Satellite and rain radar images • Radar (radio detection and ranging) images: • Predict when and where precipitation will occur • Satellite images: • Predict cloud cover • Show wind speed • Show wind direction
Satellite images Source: BOM
What to do: Satellite images • In pairs, choose a satellite image (same date and time as before) • Read the observation made by the BOM • Note the findings about cloud cover and precipitation • What is the weather doing at your current location? Source: BOM
Meteorologist presentation • Watch the following video of a Channel 9 news weather presentation • http://www.youtube.com/watch?v=xPVmTRJ1ggE • What does the presenter talk about? • How does the presenter stand? • Who does she look at when presenting the weather?
What to do: Meteorologist presentation • Make your own weather presentation in pairs • Use the weather forecast map and satellite image information • Refer to the images throughout the presentation • Use a recording device to record the presentation which will be played to the class • One of the pair act and the other films for the first half, then swap
![Building a Portfolio for any Weather [presenter name] [date]](https://cdn0.slideserve.com/1164796/workplace-education-series-dt.jpg)