Download
1 / 20
200 likes | 333 Views
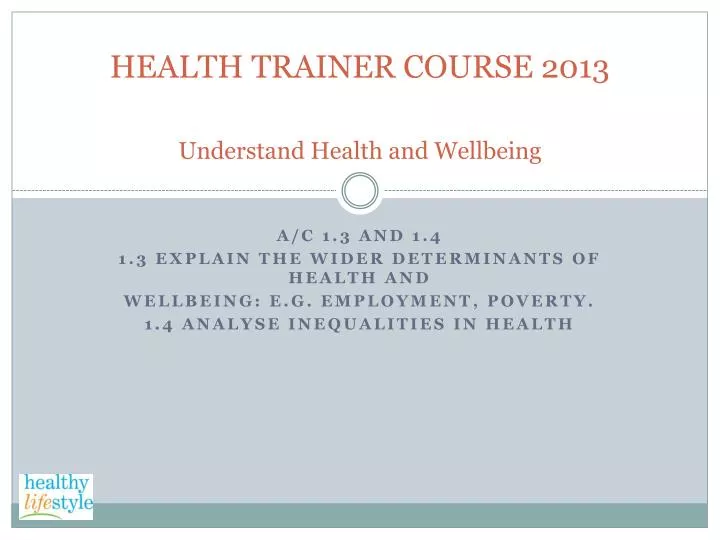
HEALTH TRAINER COURSE 2013 Understand Health and Wellbeing. A/C 1.3 and 1.4 1.3 Explain the wider determinants of health and wellbeing: e.g. Employment, poverty. 1.4 Analyse inequalities in health. England indicators - NATIONAL PICTURE Indicator Rate per 100,000 Indicator Percentages

E N D
HEALTH TRAINER COURSE 2013Understand Health and Wellbeing A/C 1.3 and 1.4 1.3 Explain the wider determinants of health and wellbeing: e.g. Employment, poverty. 1.4 Analyse inequalities in health
England indicators - NATIONAL PICTURE Indicator Rate per 100,000 Indicator Percentages Deaths – Circulatory (2007) 177 Drug use 16–24 – Age (2008/09) 23 Deaths – Respiratory (2007) 73 Alcohol consumption – Male (2008) 22 Deaths – Cancer (2007) 172 Alcohol consumption – Female (2008) 15 Deaths – All causes (2007) 575 Smoking – Male (2008) 21 Breast cancer – Female (2008) Smoking – Female (2008) 20 Lung cancer – Male (2008) 59 Lung cancer – Female (2008) 36 Childhood obesity – Reception (2008/09) 10 Childhood obesity – Year 6 (2008/09) 18 Indicator Years at birth Indicator Rate per 1,000 live births Life expectancy at birth – Males (2006–08) 78 Life expectancy at birth – Females (2006–08) 82 Infant mortality (2007) 4.8
Regional Picture An example – Prevalence of childhood obesity in reception years Percentages - Region Prevalence of obese children in reception 2008/09 North East 10.2 North West 9.6 Yorkshire and The Humber 9.6 East Midlands 9.1 West Midlands 10.1 East of England 8.7 London 11.2 South East 8.7 South West 8.9 England 9.6 Minimum 8.7 Maximum 11.2 Source: Department of Health
Wards most susceptible to experience fuel poverty in Yorkshire and Humber
LOCAL PICTURE - Bradford In the last ten years, the population of Bradford has begun to grow more rapidly again increasing from 467,668 in 2001 to an estimated 512,600 in 2010 which is an increase of about 10% . This is partly due to the number of births being greater than the number of deaths, and partly due to net international migration, where the people moving into Bradford from outside the UK outnumber the people migrating from Bradford . This trend is predicted to continue throughout the 21st century with ONS predictions forecasting an increase in population to between 588,000 and 626,000 people within the district by 2030.
Some areas of Bradford are deprived in almost every respect. A stark profile of Bradford (2010) has revealed that the gap between rich and poor is bigger than anywhere else in the country. Although the gap between rich and poor is the country’s worst, Bradford is only ranked the 32nd most deprived local authority out of the 354 in England Child poverty is rife and unemployment stands at a 13-year high. These pockets of multi-faceted deprivation are more common in Bradford than anywhere other than Liverpool, Blackpool, Birmingham and Leeds. Severe deprivation affects many different areas; parts of the district are amongst the most deprived 1% of areas in England. Bradford Council’s Local Economic Assessment and Bradford District Partnership’s State of the District
The chart below shows how the health of people in Bradford compares with the rest of England This area's result for each indicator is shown as a circle. The average rate for England is shown by the black line, which is always at the centre of the chart. The range of results for all local areas in England is shown as a grey bar. A red circle means that this area is significantly worse than England for that indicator; however, a green circle may still indicate an important public health problem.
During 2008‐2009, 15% of women reported that they were smoking at the time of delivery. There are clear ethnic differences in the percentage of women smoking during pregnancy; with 28% of White women reported they smoked to only 1.9% of Asian and British Asian women.
Bradford has the highest rate of coronary heart disease of all the West Yorkshire Local Authorities. High mortality rates from this disease are related to the high levels of deprivation, with Manningham, Toller, Little Horton, Bowling & Barkerend and Bradford Moore wards having some of the highest rates. Childhood obesity is problematic in the district, with 10.0% of the District’s reception year pupils classed as being obese compared to 9.6% nationally and 9.8% regionally. And 19.9% of Year 6 children in the district are obese as opposed to 18.6% for Yorkshire and Humber. Keighley Central, Wyke, Toller, Manningham and Heaton wards in 07/08 had the highest rates of Child Obesity for Year 6 pupils. Obesity among reception year pupils was highest in Queensbury, Tong, Little Horton and Manningham.
Figures out today show the number of patients admitted to hospital with alcohol-related illness has soared in the Bradford district.... “When I started training nearly 20 years ago, it was 40 to 50-year-old men in hospital with liver disease. Now we are seeing young women – I have patients in their mid-20s who are unlikely to survive a year. My youngest who died was 25.” ... After midnight, around 70 per cent of patients admitted to BRI through A&E are there because of alcohol. Many are incapacitated and need somewhere safe to sleep it off, while others have been assaulted or in road traffic accidents. (T & A 2010)
Drugs in Bradford Drug users in the district are predominantly in the 25‐44 age groups and are ageing. Home Office data estimates for the prevalence of opiate use and / or crack cocaine use for the period 2006/07 showed that the estimated number of problem drug users in Bradford is 5,303; a rate of 16.5 per 1000 population aged 16-64.
EMPLOYMENT More than 1 in 3 people of working age in the Bradford district are currently out of work. Bradford has one of the lowest proportions of working age residents in employment of any local authority in the Yorkshire and Humber region and the proportion is lower than the national average. Worklessness is much higher among women in Bradford compared to regional and national averages. Ethnic minority groups experience higher than average workless benefit claimant rates. Those with no, or low qualification levels have the highest levels of worklessness and are the most disadvantaged group in the labour market. Worklessness rates vary by age but are higher within the younger population, with 42% of 16 to 24 year olds out of work. Disability or illness is a significant factor, with around 37% of the workless population in Bradford classed as disabled. Youth unemployment will be of increasing concern, as more school leavers and graduates enter a labour market where jobs are scarce. Bradford Joint Strategic Needs Assessment Published: March 2011