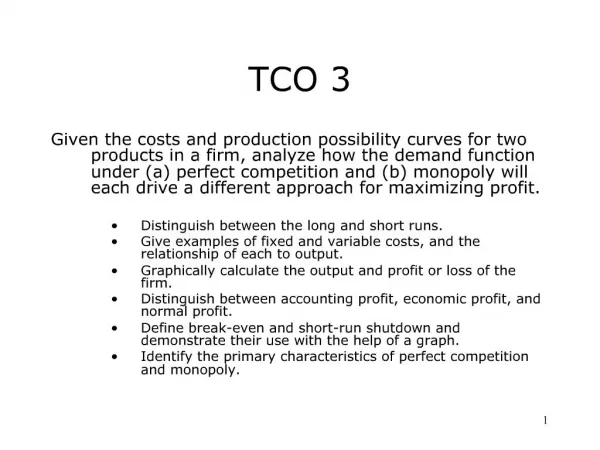
TCO 6
TCO 6. Given a change in government purchases (G) or net taxes (T), and the Marginal Propensity to Consume (MPC) of the economy, analyze the effects of these fiscal policies on equilibrium real GDP. Describe and graph a consumption function.

TCO 6
E N D
Presentation Transcript
TCO 6 Given a change in government purchases (G) or net taxes (T), and the Marginal Propensity to Consume (MPC) of the economy, analyze the effects of these fiscal policies on equilibrium real GDP. Describe and graph a consumption function. Calculate marginal propensity to consume and save (MPC and MPS) and interpret them. Explain how the economy’s macroeconomic equilibrium is reached.
Consumption • Consumption is the nation’s expenditures on all final goods and services produced during the year at market prices • Consumption was almost $2 trillion dollars in 2002 • $2,000,000,000,000 • $2,000 billion • $2.0 trillion
Four Parts of GDP • Consumption ------------ C • Investment ---------------- I • Government -------------- G • Net exports --------------- Xn
Consumption • Americans spend over 95% of their income after taxes • The total of everyone’s expenditures is called consumption • Consumption is designated by the letter C • C is the largest sector of GDP • Now C is just over two-thirds of GDP
Consumption • The consumption functions states • As income rises, consumption (C) rises, but not as quickly • Therefore, consumption varies with disposable income (DI) • DI increases . . . C increases but by a smaller amount • DI decreases . . . C decreases but by a smaller amount
Saving • Saving is NOT spending • The more we spend, the less we save • A low savings rate leads to a low productivity growth rate • Without savings ($) to invest in NEW plant and equipment, we cannot raise our productivity fast enough! • Savings includes personal saving, business saving, and a government surplus (if they have one)
Marginal Propensityto Consume (MPC) CHANGE in Consumption MPC = CHANGE in Income
Graphing the Consumption Function If Consumption rose at the same rate as Disposable Income, a graph of this function would be a 45 % line. 31
Graphing the Consumption Function DI C S 3000 1750 ? Consumption is the vertical distance between the bottom (horizontal) axis and the “C” line.
Graphing the Consumption Function DI C S 3000 1750 1250 Saving is the vertical distance between the “C” line and the 45 degree line.
Graphing the Consumption Function DI C S 3000 1750 1250 2000 1440 Consumption is the vertical distance between the bottom (horizontal) axis and the “C” line.
Graphing the Consumption Function DI C S 3000 1750 1250 2000 1440 560 Saving is the vertical distance between the “C” line and the 45 degree line
Graphing the Consumption Function DI C S 3000 1750 1250 2000 1440 560 1000 1000 Consumption is the vertical distance between the bottom (horizontal) axis and the “C” line.
Graphing the Consumption Function DI C S 3000 1750 1250 2000 1440 560 1000 1000 0 Saving is “0” at 1000 DI because there is NO distance between the C line and the 45 degree line.
Graphing the Consumption Function DI C S 3000 1750 1250 2000 1440 560 1000 1000 0 0 625 Consumption is the vertical distance between the bottom (horizontal) axis and the “C” line.
Graphing the Consumption Function DI C S 3000 1750 1250 2000 1440 560 1000 1000 0 0 625 When DI is “0” the level of Consumption is called Autonomous Consumption (AC)
Graphing the Consumption Function DI C S 3000 1750 1250 2000 1440 560 1000 1000 0 0 625 -625 Saving is the vertical distance between the “C” line and the 45 degree line. Saving is negative to the left of where the C line crosses the 45 degree line
The Determinants of Saving • There is no single reason why people save • Some spend virtually all of their disposable income • Some spend more than they earn • Americans now save less than 5 percent of disposable income • Americans used to save 7 - 10 percent of disposable income
Investment • “Investment” is the thing that really makes our economy go and grow! • Investment is any NEW: • Plant and equipment • Investment is: • Additional inventory • Investment is any NEW • Residential housing
Inventory Investment Includes only net change DateLevel of Inventory Jan. 1, 2003 $120 million July 1, 2003 145 million Dec. 31, 2003 130 million Started the year with $120 million Ended the year with 130 million Net change is a (+) 10 million
Investment in Plant and Equipment • Investment in plant and equipment is more stable than inventory • Even in bad years companies will still invest a substantial amount in new plant and equipment • This is mainly because old and obsolete factories, office buildings, and machinery must be replaced • This is the depreciation part of investment
Residential Construction • Involves replacing old housing as well as adding to it • Fluctuates considerably from year to year • Mortgage interest rates play a dominant role
Investment • Investment is the most volatile sector in our economy GDP = C +I+ G + Xn • Fluctuations in GDP are largely fluctuations in investment
Gross Investment versus Net Investment • In the equation GDP = C + I + G + Xn • The “I” represent gross investment • Gross investment - depreciation = net investment • Depreciation is taking into account for the fact that plant & equipment wear out and houses deteriorate
Investment • In the equation • GDP = C + I + G + Xn • the “I” represent Gross Investment • Gross Investment - Depreciation = Net Investment • depreciation is taking into account for the fact that plant & equipment wear out and houses deteriorate. • Start the year with 10 machines • bought -----------> 6 machines (gross investment) • worn out/obsolete - 4 machines (depreciation) • end the year with 12 machines • actual gain of ---> 2 machines (net investment)
Determinants of the Level of Investment • Sales outlook • Capacity utilization rate • Interest rate • Expected rate of profit (ERP)
The Interest Rate • You won’t invest if interest rates are too high Interest rate = The interest paid / The amount borrowed Assume you borrow $1000 for one year @ 12% , how much interest do you pay? X .12 = $1000 X = $120
The Interest Rate • You won’t invest if interest rates are too high Interest rate = The interest paid / The amount borrowed Assume you borrowed $1000 for one year and paid $120 interest. What was the interest rate? $120 X = $1000 X = .12 = 12 %
Expected Rate of Profit-ERP Expected Profits ERP = ------------------------------------------- Money Invested How much is the ERP on a $10,000 investment if you expect to make a profit of $1,650?
How much is the ERP on a $10,000 investment if you expect to make a profit of $1,650? Expected Profits ERP = ------------------------------------------- Money Invested $1,650 ERP = ------------------------------------------- $10,000 ERP = .165 = 16.5 %
Graphing the C + I Line To keep things simple so we can read the graph we’re going to assume the level of investment stays the same for all levels of income.
Graphing the C + I Line How much is I when disposable income is 1000, 2000, and 3,000? The C line and the C+I line are parallel. Therefore I is about 480 atevery level of disposable income.
Total Saving • Every economy depends on saving for capital formation • Individual saving + business saving + government saving = Total Saving • Declines in household saving has been offset somewhat since 1993 by a sharp rise in government saving and business saving
Introduction: The Growing Economic Role of Government • Most of the growth over the past seven decades was due to the Depression and World War II • Since 1945 the roles of government at the federal, state, and local levels have expanded • The seeds of that expansion were sown during the Roosevelt administration • The government exerts four basic influences • It spends more than $3.0 trillion • It levies even more in taxes • It redistributes hundreds of billions of dollars • It regulates the economy
State and Local Government Spending • Main expenditures • Education • Health • Welfare • Spending is a little more than half the level of federal spending • Police protection and prisons are now straining state and local budgets
Government Purchases versus Transfer Payments • The federal, state, and local governments spends over $3.0 trillion a year • GDP = C + I + G + Xn • Approximately half are “transfer payments” • The largest transfer payment is social security • These payments end up in the “C” part GDP • Approximately half are “government purchases” • The largest government purchase is defense • These end up in the “G” part of GDP
Graphing the C + I + G + Xn Line To keep the graph as simple as possible, we are assuming the government spends a constant amount of money regardless of the level of disposable income
Graphing the C + I + G + Xn Line How much is G? Answer: 400
The Average Tax Rate and the Marginal Tax Rate This is a hypothetical illustration Income Marginal Total Average Level Tax Rate Tax Taxes Tax Rate 0 - $100 0 % $ 0 $ 0 0.0 % $101 - $200 10 % $10 Additional Taxes Paid ( $10) MTR = -------------------------------- Additional Taxable Income ($100) The Marginal Tax Rate (MTR) is the rate you pay on the last dollars you earned
Types of Taxes • Direct tax • A tax with your name on it • Indirect tax • A tax on things
Types of Taxes • Progressive taxes • Places a greater burden on those best able to pay and little or no burden on the poor • Proportional taxes • Places an equal burden on the rich, the middle class, and the poor • Regressive taxes • Places a heavier burden on the poor than on the rich
The Basis for International Trade • The basis for international trade is that a nation can import a particular good or service at a lower cost than if it were produced domestically • In other words, if you can buy it cheaper than you can make it you buy it • This maxim is true for individuals and nations • This is called specialization and exchange
A Summing Up: C + I + G + Xn Net exports = Xn Xn = Exports - Imports
C + I + G + Xn Why is the C + I + G + Xn line lower than the C + I + G line? Answer: It is lower because net exports (Xn) are negative.