Download
1 / 40
400 likes | 506 Views
Explore Strange Quark Matter (SQM), Strangelets, detection methods, and cosmic ray evidence of exotic nuclear fragments. Learn about theoretical models and experimental observations of rare events in cosmic rays. Discover the potential presence of SQM in neutron stars and the Earth's atmosphere.

E N D
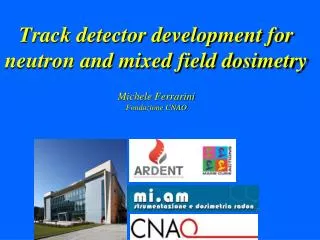
Characterization of Nuclear Track Detectors to Search for Rare Events in Cosmic Rays ATANU MAULIK Center for Astroparticle Physics and Space Science Bose Institute Kolkata, INDIA
What is Strange Quark Matter (SQM) ? • SQM is a proposed state of hadronic matter containing roughly equal numbers of up, down and strange quarks. • It has been suggested by various authors [Witten(1984) etc.] that SQM and not normal nuclear matter is the true ground state of hadronic matter. • The stability of SQM cannot yet be determined from first principles within QCD but has been addressed in various phenomenological models like the MIT bag model. • Such calculations[Farhi(1984),Madsen(1993) etc.] show that for significant part of the reasonable parameter spaces in those models SQM can be stable for baryon number greater than some minimum value Amin ~ 50-1000 although shell effects may cause islands of stability for A values smaller than Amin
What are Strangelets ? • Small stable lumps of SQM is what is being referred to as strangelets. • Such strangelets will have a small positive charge, thus an unique experimental signature of strangelets is an unusually low charge to mass ratio (Z/A<<1/2) compared to ordinary nuclei. • The decay of normal nuclear matter into strange matter will require about a third of the up and down quarks to transform simultaneously into strange quarks via weak interactions, making it prohibitively unlikely.
Where can SQM be found and how can they reach earth ? • SQM, if stable is almost unavoidable in the core of dense steller objects like neutron stars. • Strangelets may be produced when two such stars in a binary system collide. • A strange star – black hole collision may also release lumps of quark matter. • Certain calculations suggest a galactic production rate equivalent to 10 -10 M⊙ yr -1 • Strangelets in many ways behave like ordinary cosmic ray nuclei and are accelerated by similar mechanisms e.g. Fermi acceleration in supernova shocks. • Theoretical studies [ Madsen (2005)] point to significant measurable strangelet flux in our part of the galaxy.
Inside the earth’s atmosphere • According to one model of strangelet propagation [S. Banerjee et.al (2000)] an initially small strangelet passing through the earth’s atmosphere, would pick up mass by preferentially absorbing neutrons over protons from the nuclei of atmospheric atoms, protons being Coulomb repelled. As a consequence Z/A ratio gets even more skewed. • At the same time the strangelet will lose energy through ionisation of the surrounding media which effectively puts a lower limit to the altitude at which it can be detected. • For example a strangelet with initial mass ~ 64 amu , charge ~ 2 and β ~ 0.6 will evolve to mass ~ 340 amu and Z~10 -20 at an altitude of 3.6 Km above sea level and will have β ~ 0.01. So it will have a Z/β ~ 1000-2000. • The flux of strangelets at that altitude is estimated to be 5-10/100sq.m./yr.
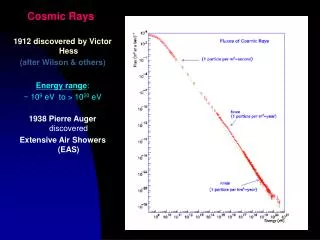
Reports of events with unusual Z/A ratio • There are several observations of exotic nuclear fragments with unusual charge to mass ratio in different cosmic ray experiments. • In 1990, Saito et al. analyzed the data of 1981 balloon borne experiment and claimed to have identified two events which were consistent with A ~ 370 and Z ~ 14 and was explained in the scheme of strange quark matter. • In 1993 Ichimura et al. reported an event with unusually long m.f.p. called the ‘exotic track’ event with Z ~ 20 and A ~ 460. The report was based on an analysis of a 1989 balloon borne experiment using solid state nuclear track detector. • In a paper in 2001 Fujii et. al. reported detection of a possible SQM candidate, an anomalous massive nuclei of charge Z~14 and M~370 amu in a hybdrid system combining active (Cherenkov and scintillation )and passive detectors (CR-39) in a 19 hr balloon flight. • Analysis of data from AMS-01, which flew to space on board Space Shuttle Discovery, has given hints of some interesting events, such as one with Z=8, A=54 [Aguilar et.al.(2002)]
Choice of detector for strangelet search • An ideal choice of detector for detecting strangelets with such low flux and at such high altitudes are Nuclear Track Detectors (NTDs) deployed over a large area. NTDs are basically dielectric solids like polymer (plastic), glass etc. • Such detectors have various advantages : (a) Simplicity and ease of use: Since they do not require power for their operation it is relatively easy and inexpensive to set up large passive detector arrays at remote locations. (b) Existence of natural thresholds of registration: which provides a natural and easy way of suppressing the background. (c) They offer a good charge resolution.
How polymer track detectors work ? • Heavy charged particles on their passage through materials loose energy according to the Bethe formula : - dE/dx=(4πe4z2/m0v2)NZ[ln(2m0v2/I)-ln(1-v2/c2)-v2/c2] • The ionization and excitation produced by the charged particles along their path causes molecular bonds to break, thereby producing narrow(30-100Å) damage trails. Naturally the damaged portions become chemically more reactive to suitable chemical reagents (etchants) (e.g. ionic compounds like NaOH) compared to the undamaged bulk material. • During etching, the material along the damage trails are etched out at a much higher rate VT (Track etch rate) compared to the rate of etching VB also called VG (Bulk etch rate) of the undamaged surface. The etch pits so formed can be closely approximated by geometrical cones with the damage trail along its axis and is observable under an optical microscope.
Determination of VT / VB • The ratio VT/VB = f(dE/dx) and hence (Z/β)2of the incident ion is called the charge response of the detector. • It can be determined by studying the geometry of etch pit openings and is given by the formula: VT/VB=Zobs/[VB×t×cos(i)]+1/cos(i) Where i is the incident angle, cos(i)=Db/Da, where Da and Db are the major and minor axis of etch pit openings. Zobs is the depth of the tip of the etch cone from the surface. t is the duration of the etching process. • The ratio VT/VB as well as the range R of the particle inside the detector are the two most important parameters which help us in identifying the particle forming the track.
Choice of NTD for strangelet search • Widely used polymer detectors like CR-39 and Lexan are unsuitable for rare event search, because their very low Z/β detection threshold [for CR-39: (Z/β)thres> 6, for Lexan:(Z/β)thres>57] compared to the predicted Z/β values of strangelets of 1000 – 2000 at mountain altitudes will result in their recording of a huge low-Z background • A particular brand of overhead projector (OHP) transparencies was found to be very suitable as a NTD. Elemental analysis revealed that the plastic was Polyethylene Terephthalate (PET) with chemical formula (C10H8O4)n . This was reconfirmed with IR spectroscopy. • Crucially, it was found that PET has a much higher detection threshold [(Z/β)thres > 120] compared to other commercially available NTDs and as such is significantly better at background suppression. • Another advantage of PET is that it is substantially cheaper compared to detectors like CR-39. • Once PET was selected as the NTD of choice, systematic campaign was initiated to characterize and calibrate PET.
Etching • Exposed detectors are cut into small pieces and are dipped into the etchant once the desired temperature is reached. • During etching the solution is stirred continually. It helps in maintaining a uniform temperature and concentration and prevents the build up of etchants.
Determination of ideal etching condition • The etch pit geometry depends on the temperature and the concentration of the etchant and also the duration of etching. • The goal was to maximize the charge response VT/VB and to see whether the track quality is good. • An exposed PET detector was etched in NaOH soln. at three different concentrations (5.0N,6.25 N,7.5N) and at three different temperatures (45°C,55°C,70°C). • It can be seen that VT/VB is getting maximized at the concentration of 6.25 N and at the temp. of 55°C. Track quality was also good. • So we have used 6.25 N NaOH soln. at temp 55° ± 0.1°C for subsequent etching processes.
Charge response study of PET • In order to study charge response, PET films were exposed to various ion beams from accelerators. • Ion and their energies were chosen so as to cover a wide range of Z/β values. • Incident ion energies were so chosen that they were higher than the Bragg peak energies for those ions on PET. Because at lower energies the Bethe equation starts to break down due to charge neutralization. • Beam currents and exposure durations were chosen so that the number of ions impinging on the detector lies in the range (104 – 105)/cm2. This is to prevent overlapping of tracks and detector burnout and also to optimize the data analysis process.
Experimental arrangement for 16O exposures at IUAC, New Delhi
Calibration of PET with 16O beam • The charge response of the PET detector was studied using 53.6 MeV 16O – ions at IUAC, New Delhi. • To determine the charge response of the detectors at different energies, they were exposed at varying distances from the flange, with the air gaps between the flange of the beam pipe and the detectors acting as the energy degrader. • Eight separate runs were used and the incident energies were allowed to vary between 16.2 MeV and 24.4 MeV.
Calibration curve for 16O - ions • The adjoining image shows the charge response parameter VT/VB of PET plotted against corresponding Z/β values. • If the response curve is extrapolated towards lower values of Z/β, we could see that the threshold will be obtained at around Z/β ~ 120, which supports the claim that PET has a higher detection threshold compared to CR-39 or Lexan.
Charge response studies using Iron (56Fe) and Sulphur (32S) beams at IUAC • Charge response of PET was also studied using Iron (56 Fe) & Sulphur (32S) ion beams from the Pelletron accelerator at IUAC. • This time the GPSC facility was used for the purpose of irradiating the detectors.
Experimental setup • Small (5 cm x 5 cm) pieces of PET were mounted on aluminum holders and were placed on top of two movable arms inside the GPSC. • By moving those two arms it was possible to vary the energies with which the ions will be impinging on the PET detectors after being scattered by a 250 µg/cm2 gold foil used as a scatterer.
Experimental setup (contd.) • For one set of those aluminium holders placed on one of the arms, the frames holding the films were turned by an angle of 30° so that the incidence angle of the impinging ions was 30° . • This was done so that one can get a better view of the conical etch pits after etching thereby enabling a more precise determination of the depth of the tip of the etch cone (Zobs).
Experiment with Iron beam • Beam energy : 150 MeV (~ 2.7 MeV/A) • Beam current: 1 pnA • Three separate runs were used. • The two arms inside the GPSC with the detectors mounted on top of them were placed at angles between 20 – 145 degrees with respect to the beam direction. So the energies of the scattered ions impinging on the detectors were between 140 – 50 MeV.
Fe – tracks on PET • Tracks after 3 hr etching, with the microscope focused on the surface. (Incident ion energy 130 MeV) • The conical profile of the tracks could be seen with the microscope focused at a depth of 9μm.
Experiment with Sulphur beam • Beam energy : 125 MeV (~ 3.9 MeV/A) • Beam current : 1 pnA • Two separate runs were used. • Detectors were placed making angles between 20-160 degrees with respect to the beam direction. The incident energies were between 120 - 65 MeV.
S – tracks on PET • Tracks after 3 hr etching. (Energy of incident ions ~ 118 MeV) • Conical profile could be seen with the microscope focused at a depth of 5μm
Calibration with 238U-ions at GSI • The charge response of PET to heavier ions was also studied using 11.1 MeV/n 238U – ion beam from GSI, Darmstadt, Germany. • This time Aluminium foils of various thicknesses were used to degrade the energy to different values.(774.5 MeV, 1724.5 MeV, 2641.8 MeV) • The value of VT/VG increases with Z/β in the range 600-750 but then it decreases. • It so happens because the data point corresponding to the lowest energy (774.5 MeV) lies on the left side of the Bragg peak where dE/dx decreases with decreasing energy, i.e. with increasing Z/β. Hence VT/VB which is proportional to dE/dx also decreases with increasing Z/β.
Experiment at CERN • Experiment utilized 20° beam line of the REX-ISOLDE facility at CERN • 2.82 MeV/u 129Xe and 78Kr beams were produced in the ISOLDE GPS target and accelerated with the REX-ISOLDE linear accelerator. • The 78Kr beam contained an admixture of 49Ti ions which provided an additional data point for calibration.
Interior of the target chamber used for the irradiations. • PET films were cut into rectangular strips (8 cm x 3.5 cm) and mounted onto the downstream side of the target ladder. This ensured that exposed areas were well defined. • Faraday cup was used for monitoring beam current. Faraday cup Target ladder
Kr and Ti tracks on PET The different dimensions for 78Kr and 49Ti tracks can be seen with the microscope focused (a) on the surface and (b) at a depth of 8.2 micron from the surface.
Diameters and lengths of Xe tracks on PET • Adjoining figures show the variation of the diameters and track lengths for the 129Xe tracks on PET with the duration of etching. • The monotonic rise with etching duration implies a consistency in the rate of etching of PET.
Comparison of track lengths and diameters • The adjoining figures compare the track diameters and lengths for Ti, Kr and Xe ions, all with energies of 2.82 MeV/u after 2 hr etching. • The same energy per nucleon implies the same value of β. • Thus the differences in diameter and length reflect differences in Z for the three ions.
Particle identification with PET • dE/dx vs Range curves for various ions were obtained using the code SRIM [Zeigler et. al.( 2003)] • The dE/dx vs range values for tracks of 2.82 MeV/u 49Ti ions was then plotted. • Calibration curve without REX-ISOLDE data used. • Charge Z could be ascertained with an accuracy of ± 1 • Corresponding incident energy is 2.61 ±0.24
Detectors exposed to cosmic rays. Darjeeling (2200 m) Ooty (2200 m) Kolkata Hanle (4500 m)
References • Witten, E., Phys. Rev. D30 (1984) 272. • Farhi, E. and Jaffe, R.L., Phys. Rev. D30 (1984) 2379. • Madsen, J., Phys. Rev.Lett.70 (1993) 391. • Madsen, J., Phys. Rev.D71(2005) 014026. • Banerjee, S., Ghosh, S.K., Raha, S., Syam, D., Phys. Rev. Lett. 85 (2000) 1384. • Saito,T., Rev. Lett. 65 (1990) 2094. • Ichimura, M., et. al., Nuovo Cimento 106A (1993) 843. • Aguilar, M., et. al.,Phys.Rep. 366 (2002) 331. • Fuji,M., et.al.,Rad.Meas. 34 (2001) 255. • Ziegler,J.F.,Biersack, J.P., 2003. The Stopping and Range of Ions in Matter (SRIM Computer Code), Version:2003.26 .
Publications and patent • Charge response of polyethyelene terephthalate polymers (PET) to light and heavy nuclei _ B. Basu, S. Dey, B. Fischer, A. Maulik, A. Mazumdar, S. Raha, S. Saha, Swapan K. Saha , D. Syam. Radiation Measurements 43 (2008) S95 – S97 • Polyethylene terephthalate polymers at mountain altitude as cosmic ray heavy particle detector _ B. Basu, S. Biswas, S. Dey, A. Maulik, A. Mazumdar, S. Raha, S. Saha, Swapan K. Saha, D. Syam. Radiation Measurements 43 (2008) S262 – S265 • Determination of the depth of an etch pit through studies of diffraction rings _ B.Basu, S. Dey, A. Maulik, S. Raha, S. Saha, Swapan K. Saha, D. Syam . Radiation Measurements 44 (2009) 359-362 • Characterization and calibration of a SSNTD for heavy-ion detection and strangelet search in cosmic rays _ D. Bhowmik, S. Dey, A. Maulik, Sibaji Raha, S. Saha, Swapan K. Saha, D. Syam. Nuclear Instrum. and Meth. B 269 (2011)197-201 • Calibration of a solid state nuclear track detector (SSNTD) with high detection threshold to search for rare events in cosmic rays _ S. Dey, D. Gupta, A. Maulik, Sibaji Raha, Swapan K. Saha, D. Syam, J. Pakarinen, D. Voulot, F. Wenander.Astroparticle Physics 34 (2011) 805 -808 Indian patent application [No. 1473/KOL/2011] titled “A novel solid state nuclear track detector for charged particles” filed on 18 Nov. 2011