Download
1 / 8
80 likes | 179 Views
Explore improvements in earthquake detection, location accuracy, and detection times from 2003-2006 in the ANSS Backbone network. See how the addition of seismic stations enhanced network capabilities.

E N D
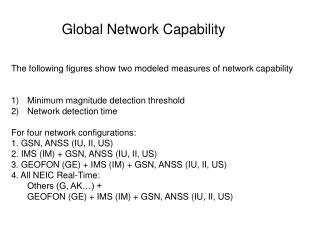
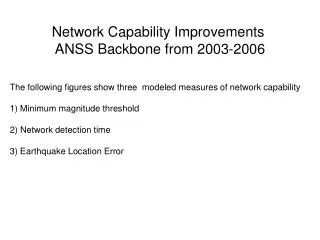
Network Capability Improvements ANSS Backbone from 2003-2006 • The following figures show three modeled measures of network capability 1) Minimum magnitude threshold • 2) Network detection time • 3) Earthquake Location Error
Magnitude Threshold 2003 ANSS Backbone The map to the left shows the minimum moment magnitude (Mw) detectable in each 1 degree grid cell by the combined 2003 ANSS Backbone network (BK, IU, II, US). The minimum Mw level for each grid cell is modeled by computing the minimum Brune earthquake amplitude (Brune 1970) that exceeds ambient noise levels at 5 stations(McNamara and Buland, 2003). Ambient noise levels are taken from the mode of the PDF distribution for several years of BHZ noise observations. See McNamara et al., (2004) for method details. References: McNamara, D.E., and R. Buland, ANSS Detection threshold, 15th Annual IRIS Workshop, 19-21 June, Yosemite, CA, 2003. McNamara, D. E. and R.P. Buland, Ambient Noise Levels in the Continental United States, Bull. Seism. Soc. Am., 94, 4, 1517-1527, 2004.
Magnitude Threshold 2005 ANSS Backbone During the 2003-2005 field seasons, 12 broadband seismic stations (yellow triangles) were added to the ANSS backbone network with support from the NSF Earthscope program. The map to the left shows the ANSS backbone network minimum moment magnitude (Mw) detectable in each grid cell at the end of 2005. Mw detection capability is improved in a broad region due to the addition of 12 new stations. 2006 ANSS Backbone During the 2006 field seasons, 14 broadband seismic stations (red triangles, 2 in AK) were added to the ANSS backbone network. The map to the left shows the ANSS backbone network minimum moment magnitude (Mw) detectable in each grid cell at the end of 2006. Mw detection capability is improved in a broad region due to the addition of 14 new stations.
Detection Time The map to the left shows the time in minutes for the initial P-wave from an earthquake in each 1 degree grid cell to be detected by the first 5 stations in the 2003 ANSS Backbone Network. The P-wave travel time for an earthquake in each grid cell is modeled with the Tau-P method using the IASPEI91 Earth model (see McNamara et al., 2005 for method details). Detecting station distribution is determined from the minimum Mw detection results from the previous slides. References: McNamara, D., R. Buland and H. Benz, Capabilities of the Advanced National Seismic Network, Seismo. Res. Lett.,76, 2005.
Detection Time 2005 ANSS Backbone During the 2003-2005 field seasons, 12 broadband seismic stations (yellow triangles) were added to the ANSS backbone network with support from the NSF Earthscope program. The map to the left shows the ANSS backbone network detection time in each grid cell at the end of 2005. Mw detection time is reduced in a broad region due to the addition of 12 new stations. 2006 ANSS Backbone During the 2006 field seasons, 14 broadband seismic stations (red triangles, 2 in AK) were added to the ANSS backbone network. The map to the left shows the ANSS backbone network detection time in each grid cell at the end of 2006. Mw detection time is improved in a broad region due to the addition of 14 new stations.
Location Error The map to the left shows the theoretical earthquake location error in each 1 degree grid cell for the combined 2003 ANSS Backbone network (BK, IU, II, US). We map the length of the major axis of the error ellipse in km. For this preliminary analysis we assume Surface source and use a P-wave fist arrival at each real-time station (see McNamara et al., 2005 for method details). References: McNamara, D. E. , P. Earle, R.P. Buland and H. M. Benz, An Assessment of Proposed Upgrades to the ANSS Backbone and GSN, 17th Annual IRIS Workshop, 16-20 June, WA, 2005.
Location Error 2005 ANSS Backbone During the 2003-2005 field seasons, 12 broadband seismic stations (yellow triangles) were added to the ANSS backbone network with support from the NSF Earthscope program. The map to the left shows the ANSS backbone network theoretical earthquake location error in each grid cell at the end of 2005. Location error is reduced in a broad region due to the addition of 12 new stations. 2006 ANSS Backbone During the 2006 field seasons, 14 broadband seismic stations (red triangles, 2 in AK) were added to the ANSS backbone network. The map to the left shows the ANSS backbone network location error in each grid cell at the end of 2006. Location error is reduced in a broad region due to the addition of 14 new stations.
Magnitude Threshold Contribution from Regional Networks IW Network: 13 new stations in Idaho, Montana, Wyoming and western Colorado lower the detection threshold to Mw~2.0-2.4 for the region and detection time to < 30 sec near the highest concentration of stations in western Wyoming. Detection threshold is likely saturated around Mw~2.0 due to the short period filters and data sampling rate used by the ANSS NOC event detector. Also, high cultural noise sources occur at high frequencies near the source corner frequency (~30Hz) for small earthquakes (Mw~2.0). Detection Time