Download
1 / 28
280 likes | 360 Views
Explore traffic count comparisons, future analysis measures, and validation tools using the On-The-Fly-Visualizer (OTFVis). Learn how to create, visualize, and validate traffic count data formats and parameters for further analysis. Dive into Swiss Microcensus, trip distributions, and more validation measures. Discover interactive visualization tools like OTFVisJava and MATVis Replay for in-depth analysis. Get hands-on with exercises to compare scenarios and configure simulations. Start your traffic analysis journey today!

E N D
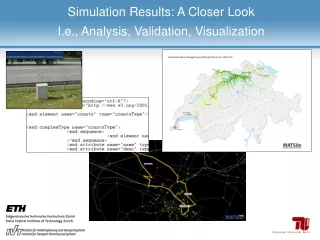
Simulation Results: A Closer LookI.e., Analysis, Validation, Visualization
Learning Objectives • Creating and analyzing traffic count comparisons • Getting a rough idea of further analysis measures and validation problems • Using the On-The-Fly-Visualizer (OTFVis)
Now! • Start download of • wuIST.mvi and • wuWU.mvi (> 60 MB, each) • (zurich-switzerland.xml) • @ http://www.matsim.org/node/412 → Exercises → Exercise 1 and (2)
Traffic Counts • Average hourly volumes of avg. working day • Future: Median, Variance, Max, Min (n days)
Traffic Counts: Parameters Config file <module name="…"> … </module> <module name="counts"> mandatory: <param name="inputCountsFile" value="/path/to/counts.xml" /> <param name="outputformat" value="txt, html, kml" /> optional: <param name="countsScaleFactor" value="Double > 0 " /> <param name="distanceFilter" value="Double >= 0" /> <param name="distanceFilterCenterNode" value="String" /> </module>
Traffic Counts: Parameters <param name="distanceFilter" value= "15000" /> <param name="distanceFilterCenterNode" value= "2531" /> Swisstopo
Traffic Counts: Ex Post Creation • Restraining the area of analysis • Take playground.anhorni.kti.CountsAnalyser or playground.dgrether.analysis.CountsAnalyser as an example (will be implemented in the core soon) • linkstats.txt → counts
Traffic Counts Creation: Example CH Map Mapping Stations → Links NAVTEQ TELEATLAS ARE … Filtering DIDO Public Holidays Summer Holidys Outliers Raw count data ASTRA, cantons, cities Averaging per station Conversion TXT → XML xml schema counts_v1.xsd http://matsim.org/files/dtd/counts_v1.xsd Parser/Writer counts.xml
Further Analysis / Validation Measures • Swiss Microcensus • Trip length and duration distributions • Modal Split Spiders Route switchers Volumes
Validation Issues • Lack of Validation Data and System Specification • Level of aggregation (analysis and modeling) (e.g. count data vs. avg. trip length, route switcher analysis etc.) • MS = Sampling tool → Ensemble runs → confidence intervals etc. (computational costs!) • Future Measures • Travel speeds (underestimation: junction dynamics, non-linearities?) • Facility loads (e.g., retailer consumer cards) • A lot of interesting future work!
Visualizers OTFVisJava + OpenGL MATVis ReplayC++
OTFVis: Live Mode config Interactive queries in the live mode
OTFVis: Playback Mode mvi file events file + network file
OTFVis: Playback Mode large scale simulations: time and memory consuming Interactive queries in the live mode Queries in the playback mode MATVis Replay (Daumenkinos) Written in C++ Events not compatible mit Java Mobsim Room for participation
Exercises – OTFVis: Westumfahrung • WU: Bypass Zurich → M. Balmer (15:30)
Exercises - OTFVis • Building the bypass (WU) has made worse a prominent bottleneck in the region of Zurich. Try to locate it by using the OTFVis. It is best visible between ~ 7:15 and 9:00. It is not visible very clearily in our results, but … Hint:
Exercises – OTFVis Comparing 2 WU (Westumfahrung) scenarios Scenario 1: actual state (base case) => convert events.run365.it150.txt.gz → wuIST.mvi 60 Scenario 2: with bypass (Westumfahrung) => convert events.run370.it220.txt.gz → wuWU.mvi 60
Exercises - OTFVis Comparing 2 scenarios with OTFVis
Exercises – Google Earth 2. a) Using Google Earth with 100.countscompare.kmz look at the count stations in the south of Switzerland (Tessin, e.g., Lugano, Mendrisio). b) Look at the count stations in the center of Zurich (e.g.,Rosengartenstrasse, Nordring) c) What is the difference? What is the problem in question a)
Exercises – Counts Configuration & OTFVis 3.Configure a ZH simulation based on zurich-switzerland.xml such that counts are plotted only within a restricted area: center = Bellevue and radius = 10 km. I.e.; inspect network by OTFVis and define distanceFilterCenterNode in the count section of the config file. Config file <module name="counts"> <param name=„… </module>
Exercises – „Solution 1“ e.g. 07:13 base case w/ bypass
Exercises – „Solution 1“ e.g. 08:27 base case w/ bypass
Exercises – „Solution“ 2 2. a) e.g., Mendrisio
Exercises – „Solution“ 2 2. b) e.g., Rosengartenstrasse
Exercises – „Solution“ 2 2. c) Boundary of modeling area → Task nbr 3!
Exercises – „Solution“ 3 <link id="95214" from="156384139" to="300386714" … /> <link id="95215" from="300386714" to="156384136" … /> network.xml <param name="distanceFilter" value= "10000" /> <param name="distanceFilterCenterNode" value= "300386714" />