Download

1 / 10
100 likes | 245 Views
LECTURE 14 OUTLIERS AND MULTICOLLINEARITY. OUTLIER ANALYSIS 1. VISUAL DISPLAY 2. INTERACTIVE INSPECTION: http://www.stat.uiuc.edu/~stat100/java/guess/PPApplet.html. OUTLIERS. LEVERAGE h ii = 1/n + (Score – M x )/ x 2 (single predictor) Should be close to 1/n

E N D
LECTURE 14OUTLIERS AND MULTICOLLINEARITY • OUTLIER ANALYSIS • 1. VISUAL DISPLAY • 2. INTERACTIVE INSPECTION: http://www.stat.uiuc.edu/~stat100/java/guess/PPApplet.html
OUTLIERS • LEVERAGE • hii= 1/n + (Score – Mx)/x2 (single predictor) Should be close to 1/n • Centered: h*ii= hii- 1/n
OUTLIERS • Test: t(case I deleted)= [resid(i)/ 1- hij] / [MSres(i)/(1- hij )] • Where resid(i) = residual of Y-Ymni with case i removed • SPSS- take case i out, run analysis with SAVE
OUTLIERS • MAHALANOBIS (Euclidean) distance of DV score from centroid of IVs • Cook’s D: C = (Y – Yi)2 /[(k-1)*MSres] • DFFITSi = (Y – Yi) /SQRT[MSresi hii]
OUTLIERS • SPSS: GENERAL LINEAR MODEL OPTIONS: ‘SAVE’ (check ‘Leverage Values’ and ‘Cooks’ to get hii and C Plot C and h against the cases
OUTLIERS – WHAT TO DO • DELETE • REVISE MODEL • TRANSFORM VARIABLES (LOG, SQRT, LOGIT, ARCSIN, ETC.) • ROBUST METHODS: • LTS (LEAST TRIMMED SQUARES) • VARIANT: WINDSORIZE (REMOVE TOP 5%, BOTTOM 5%) • M-estimation: weight least squares for each case by deviation from regression line
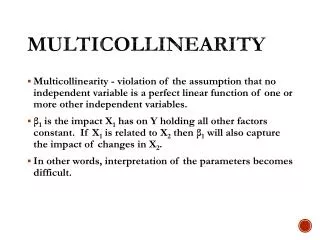
MULTICOLLINEARITY • EXACT COLLINEARITY: One IV is predicted perfectly from another set of IVs • MULTICOLLINEARITY: high correlation between one IV and another or set of other IVs
MULTICOLLINEARITY Measures • VIF- Variance Inflation Factor VIF(i) = 1 / [ 1 – R2(i.1,2,3,…k) Calculates the R-square for each predictor from all the rest of the predictors • TOLERANCE = 1 / VIF • CONDITION INDEX = max / min = largest eigenvalue over smallest
CRITICAL CONDITIONS • VIF- Variance Inflation Factor > 10 • TOLERANCE = 1 / VIF < .10 • CONDITION INDEX > 30
FIXING MULTICOLLINEARITY • REVISE MODEL • NEW DATA • RIDGE REGRESSION: SPSS Macro • PRINCIPAL COMPONENTS REGRESSION • STANDARDIZE PREDICTORS • GET PRINCIPAL COMPONENT WEIGHTS • CREATE NEW PRIN.COMP. SCORES, USE AS PREDICTORS