Download
1 / 1
10 likes | 104 Views
Tetherless World. Challenge : how to understand and use open government data Opportunities : Linked Data + Social Web + Mashup Strategy : develop and use Linked Government Data using AI+CI. Overview. DATA-GOV. Making Sense of Open Government Data.

E N D
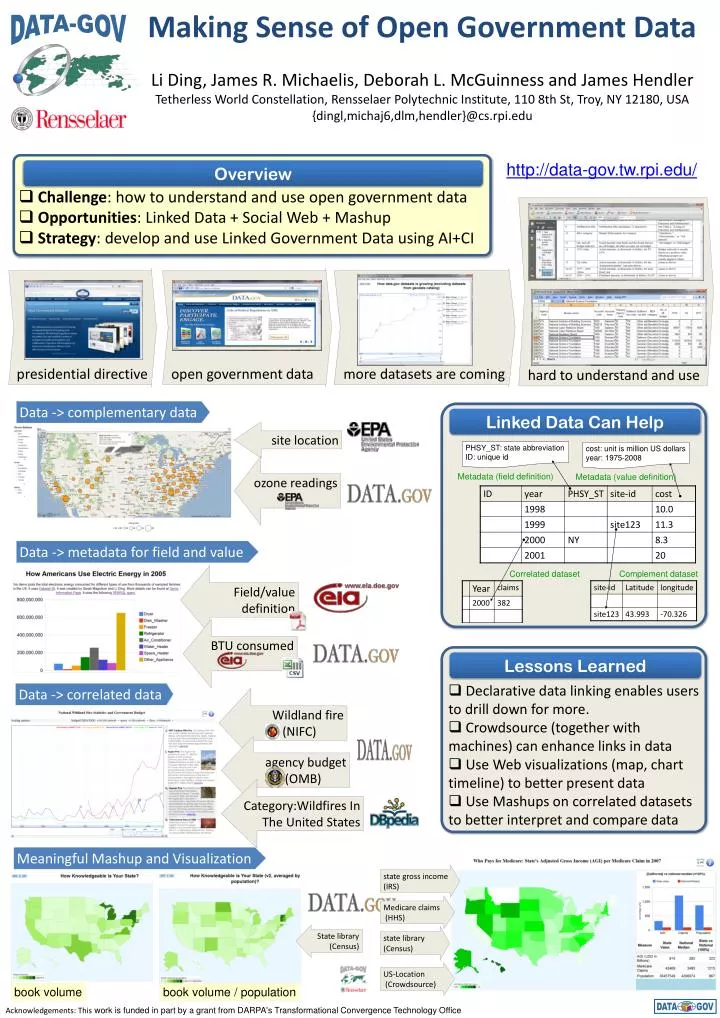
Tetherless World • Challenge: how to understand and use open government data • Opportunities: Linked Data + Social Web + Mashup • Strategy: develop and use Linked Government Data using AI+CI Overview DATA-GOV Making Sense of Open Government Data Li Ding, James R. Michaelis, Deborah L. McGuinness and James Hendler Tetherless World Constellation, Rensselaer Polytechnic Institute, 110 8th St, Troy, NY 12180, USA {dingl,michaj6,dlm,hendler}@cs.rpi.edu http://data-gov.tw.rpi.edu/ hard to understand and use DATA GOV presidential directive open government data more datasets are coming Data -> complementary data Linked Data Can Help site location PHSY_ST: state abbreviation ID: unique id cost: unit is million US dollars year: 1975-2008 ozone readings Metadata (field definition) Metadata (value definition) Data -> metadata for field and value Field/value definition Correlated dataset Complement dataset BTU consumed • Declarative data linking enables users to drill down for more. • Crowdsource (together with machines) can enhance links in data • Use Web visualizations (map, chart timeline) to better present data • Use Mashups on correlated datasets to better interpret and compare data Lessons Learned Data -> correlated data Wildland fire (NIFC) agency budget(OMB) Category:Wildfires In The United States Meaningful Mashup and Visualization state gross income (IRS) Medicare claims (HHS) State library (Census) state library (Census) US-Location (Crowdsource) book volume book volume / population Acknowledgements: This work is funded in part by a grant from DARPA's Transformational Convergence Technology Office