Download
1 / 1
10 likes | 89 Views
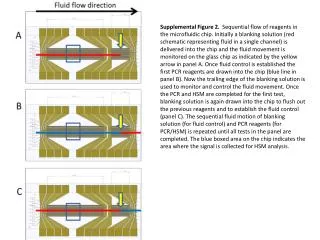
This figure depicts the sequential flow of reagents in a microfluidic chip for PCR and HSM tests. It shows how blanking solutions and PCR reagents are controlled to facilitate accurate testing. The process is repeated until all tests are completed.

E N D
Supplemental Figure 2. Sequential flow of reagents in the microfluidic chip. Initially a blanking solution (red schematic representing fluid in a single channel) is delivered into the chip and the fluid movement is monitored on the glass chip as indicated by the yellow arrow in panel A. Once fluid control is established the first PCR reagents are drawn into the chip (blue line in panel B). Now the trailing edge of the blanking solution is used to monitor and control the fluid movement. Once the PCR and HSM are completed for the first test, blanking solution is again drawn into the chip to flush out the previous reagents and to establish the fluid control (panel C). The sequential fluid motion of blanking solution (for fluid control) and PCR reagents (for PCR/HSM) is repeated until all tests in the panel are completed. The blue boxed area on the chip indicates the area where the signal is collected for HSM analysis.