Download
1 / 1

E N D
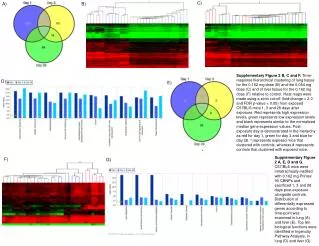
C) A) B) Supplementary Figure 2 B, C and F. Time-response hierarchical clustering of lung tissue for the 0.162 mg dose (B) and the 0.054 mg dose (C) and of liver tissue for the 0.162 mg dose (F) relative to control. Heat maps were made using a strict cut-off (fold-change > 2.0 and FDR p-value < 0.05) from exposed C57BL/6 mice 1, 3 and 28 days after exposure. Red represents high expression levels, green represents low expression levels and black represents similar to the normalized median gene expression values. Post-exposure day is demonstrated in the hierarchy as red for day 1, green for day 3 and blue for day 28. * represents exposed mice that clustered with controls, whereas # represents controls that clustered with exposed mice. D) E) * Supplementary Figure 2 A, E, D and G. C57/BL6 mice were intratracheally instilled with 0.162 mg Printex 90 CBNPs and sacrificed 1, 3 and 28 days post-exposure alongside controls. Distribution of differentially expressed genes according to time-point was examined in lung (A) and liver (E). Top ten biological functions were identified in Ingenuity Pathway Analysis, in lung (D) and liver (G). F) G)