Download
1 / 19
190 likes | 397 Views
Industrial Organization Cournot and Stackelberg. Univ. Prof. dr. Maarten Janssen University of Vienna Summer semester 2011 - Week 11. Cournot Model. 2 (or more) firms Market demand is P(Q) Firm i cost is C ( q )

E N D
Industrial OrganizationCournot and Stackelberg Univ. Prof. dr. Maarten Janssen University of Vienna Summer semester 2011 - Week 11
Cournot Model 2 (or more) firms Market demand is P(Q) Firm i cost is C(q) Firm i acts in the belief that all other firms will put some amount Q-iin the market. Then firm i maximizes profits obtained from serving residual demand: P’ = P(Q) - Q-i
P(q1) P(q1, Q-i =10) Market demand P(Q)=P(q1,Q-i=0) P(q1, Q–i =20) q1 Demand and Residual Demand
Cournot Reaction Functions • Firm 1’s reaction (or best-response) function is a schedule summarizing the quantity q1 firm 1 should produce in order to maximize its profits for each quantity Q-i produced by all other firms. • Since the products are (perfect) substitutes, an increase in competitors’ output leads to a decrease in the profit-maximizing amount of firm 1’s product ( reaction functions are downward sloping).
Cournot Model The problem Max{(P(qi+Q-i) qi – C(qi)} defines de best-response (or reaction) function of firm i to a conjecture Q-ias follows: P’(qi+Q-i)qi + P(qi+Q-i) – C’(qi) = 0 Q-i Firm i’s reaction Function r1 qi qiM qi*(qj) qj Q-i=0
Cournot Equilibrium • Situation where each firm produces the output that maximizes its profits, given the the output of rival firms • Conjectures about what the others produce are correct. • No firm can gain by unilaterally changing its own output
q2 r1 Cournot equilibrium q2M=30 r2 q1M=30 q1 Cournot Equilibrium • q1* maximizes firm 1’s profits, given that firm 2 produces q2* • q2* maximizes firm 2’s profits, given firm 1’s output q1* • No firm wants to change its output, given the rival’s • Beliefs are consistent: each firm “thinks” rivals will stick to their current output, and they do so!
Properties of Cournot equilibrium • The pricing rule of a Cournot oligopolist satisifes: • Cournot oligopolists exercise market power: • Cournot mark-ups are lower than monopoly markups • Market power is limited by the elasticity of demand • More efficient firms will have a larger market share. • The more firms, the lower will be each firm’s individual market share and monopoly power.
Different concentration measures • C4 is sum of four largest market shares • Can’t be used in highly concentrated sectors such as in mobile telephony • No difference between four firms with 25% market share and monopolist • Why 4? • Market shares of 5th, 6th etc. largest firm has no effect • HHI uses all information: sum of all squared market shares • Larger market shares get more weight
Q2 r1 B C Increasing Profits for Firm 1 A D Q1M Q1 Another look at Cournot decisions • Firm 1’s Isoprofit Curve: combinations of outputs of the two firms that yield firm 1 the same level of profit
CournotEquilibrium Profits at Cournot equilibrium Q2 Firm 2’s Profits r1 Q2M Q2* Firm 1’s Profits r2 Q1M Q1* Q1
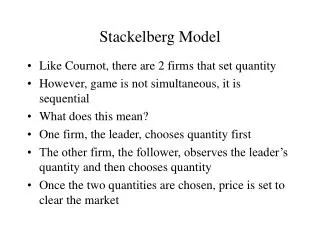
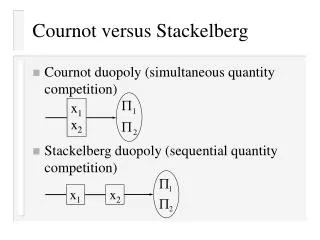
StackelbergModel • 2 (or more) firms • Producing a homogeneous (or differentiated) product • Barriers to entry • One firm is the leader • The leader commits to an output before all other firms • Remaining firms are followers. • They choose their outputs so as to maximize profits, given the leader’s output.
Q2 Follower’s Profits Decline r1 Stackelberg Equilibrium Cournot Equilibrium Q2* Q2S r2 Leader’s Profits Rise Q1M Q1* Q1S Q1 Stackelberg Equilibrium
Stackelbergsummary • Stackelberg model illustrates how commitment can enhance profits in strategic environments • Leader produces more than the Cournot equilibrium output • Larger market share, higher profits • First-mover advantage • Follower produces less than the Cournot equilibrium output • Smaller market share, lower profits
Stackelberg Mathematics I Linear Demand and No production cost Stackelberg Follower’s Profit Stackelberg Follower’s Reaction Curve:
Stackelberg Mathematics II Stackelberg Leader’s Profit Or, Optimal Output Leader: Is credibility used somewhere?
Can Cournot model be used to explain countries trade identical goods?