Download
1 / 29
290 likes | 412 Views
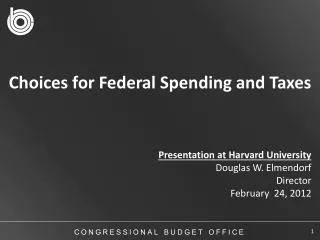
Choices for Federal Spending and Taxes Presentation at Harvard University Douglas W. Elmendorf Director February 24, 2012. Deficits or Surpluses, Historically and As Projected in CBO’s Baseline (Percentage of GDP).

E N D
Choices for Federal Spending and Taxes Presentation at Harvard University Douglas W. Elmendorf Director February 24, 2012
Deficits or Surpluses, Historically and As Projected in CBO’s Baseline (Percentage of GDP) Estimates from The Budget and Economic Outlook: Fiscal Years 2012 to 2022 (January 2012). CONGRESSIONAL BUDGET OFFICE
What Policy Assumptions Underlie the Baseline and the Alternative Fiscal Scenario? Baseline Projections: Current law. • Alternative Fiscal Scenario: • All expiring tax provisions (other than the payroll tax reduction) are extended. • The alternative minimum tax (AMT) is indexed for inflation after 2011. • Medicare’s payment rates for physicians’ services are held constant at current level. • The automatic spending reductions required by the Budget Control Act do not take effect (although the original caps on discretionary appropriations remain in place).
Deficits or Surpluses, Historically and As Projected in CBO’s Baseline and Under the Alternative Fiscal Scenario (Percentage of GDP) Estimates from The Budget and Economic Outlook: Fiscal Years 2012 to 2022 (January 2012).
Federal Debt Held by the Public, Historically and Projected in CBO’s Baseline and Under the Alternative Fiscal Scenario (Percentage of GDP) Estimates from The Budget and Economic Outlook: Fiscal Years 2012 to 2022 (January 2012). CONGRESSIONAL BUDGET OFFICE
Harms of High Federal Debt • Reduces the amount of saving devoted to productive capital and thus results in lower incomes than would otherwise occur. • Leads to high interest payments, meaning that additional tax increases or spending cuts are needed to make fiscal policy sustainable. • Makes it harder for policymakers to respond to unexpected problems, such as financial crises, recessions, and wars. • Increases the likelihood of a fiscal crisis.
Where Do We Stand? • Federal government debt is already larger relative to GDP than it has been in about 60 years. • High levels of debt cause significant harms. • Under what many people would consider to be current tax and spending policies, debt will continue to rise much faster than GDP. Clearly, we need to change policies in significant ways.
We Cannot Go Back to the Past Combination of Tax and Spending Policies • Aging of the population: The number of people age 65 or older will increase by about one-third in the next 10 years. • Rising costs for health care: During the past 25 years, health care spending per person in this country has increased nearly 2 percentage points faster per year than GDP per person. These factors and others mean that, in CBO’s projections for 2022 under the alternative fiscal scenario, outlays for Social Security and the major federal health care programs are 12.8 percent of GDP, compared with an average of 7.3 percent during the past 40 years.
We Will Need to Adopt A New Combination of Tax and Spending Policies Achieving a sustainable federal budget will require the United States to deviate from the policies of the past several decades in at least one of the following ways: • Raise federal revenues significantly above their average share of GDP; • Make major changes to the sorts of benefits provided for Americans when they become older; or • Substantially reduce the role of the rest of the federal government relative to the size of the economy. The last of these three will occur by the end of the coming decade under current law and, to a lesser extent, under the alternative fiscal scenario.
Federal Spending Apart from interest payments on the debt: • Mandatory spending: primarily benefit programs governed by rules for eligibility and benefit formulas. • Discretionary spending: policymakers decide each year how much money to provide for given activities.
Components of Mandatory Spending, Historically and Under the Alternative Fiscal Scenario (Percentage of GDP) Estimates from The Budget and Economic Outlook: Fiscal Years 2012 to 2022 (January 2012).
Discretionary Funding for 2012: $1,199 Billion Defense $670 Billion Nondefense $529 Billion (11%)
Discretionary and “Other Mandatory” Spending, Historically and Under the Alternative Fiscal Scenario (Percent of GDP) Actual Projected Estimates from The Budget and Economic Outlook: Fiscal Years 2012 to 2022 (January 2012). “Other Mandatory” includes programs designed to provide income security, such as the Supplemental Nutrition Assistance Program and unemployment compensation; retirement benefits for civilian and military federal employees; benefits for veterans; support for agriculture; and other activities. Estimates incorporate the assumption that the automatic spending reductions required by the Budget Control Act do not take effect, although the original caps on discretionary appropriations remain in place and are met through proportional reductions in defense and nondefense discretionary budget authority. CONGRESSIONAL BUDGET OFFICE
Under the Alternative Fiscal Scenario All federal spending apart from Social Security, the major federal health care programs, and interest would be 7.8 percent of GDP in 2022—the lowest share in more than 40 years and roughly two-thirds of its average share over that period. Under current law and, to a lesser extent, the alternative fiscal scenario, the country is on track to substantially reduce most federal activities relative to the size of the economy compared with the experience of the past several decades. That substantial reduction is not enough to offset the increased burden on the budget from rising spending for Social Security and the major federal health care programs. Something else must be changed as well.
Components of the Federal Budget as Shares of GDP: 1972-2011 Average and 2022 Projection Under the Alternative Fiscal Scenario (Percentage of GDP) Estimates from The Budget and Economic Outlook: Fiscal Years 2012 to 2022 (January 2012). CONGRESSIONAL BUDGET OFFICE
How Large Do Policy Changes Need to Be? To keep debt from rising relative to GDP, the deficit in 2022 would need to be about 3½ percent of GDP smaller than under the alternative fiscal scenario—or about $900 billion smaller. If changes in policy started to take effect soon but were phased in gradually, interest savings might be about $150 billion. Then, if other spending was left at two-thirds of its average share of GDP during the past 40 years, the changes in Social Security, health care programs, and taxes would need to total about $750 billion in 2022. If the changes occurred entirely in Social Security and health care programs, the cuts would be about one-quarter of what would be spent in those categories without policy changes. If the changes occurred entirely in taxes, the increases would be about one-sixth of what would be collected in taxes without policy changes.
One Approach (and Some Specific Options): Reduce Spending on Social Security and the Major Federal Health Care Programs
Spending on Social Security and Major Federal Health Care Programs, Historically and Under the Alternative Fiscal Scenario (Percentage of GDP) Actual Projected Social Security Medicare Medicaid, CHIP, and Exchange Subsidies and Related Spending Estimates from The Budget and Economic Outlook: Fiscal Years 2012 to 2022 (January 2012).
Increase the Eligibility Ages for Social Security and Medicare * Estimates from Reducing the Deficit: Revenue and Spending Options (March 2011). Estimate is for 2021.
Some Other Ways to Cut Social Security Spending * Estimates from Reducing the Deficit: Revenue and Spending Options (March 2011). Estimate is for 2021 .
Some Other Ways to Cut Federal Health Care Spending * Estimates from Reducing the Deficit: Revenue and Spending Options (March 2011). Estimate is for 2021.
Revenues Projected in CBO’s Baseline and Under the Alternative Fiscal Scenario (Percentage of GDP) Estimates from The Budget and Economic Outlook: Fiscal Years 2012 to 2022 (January 2012).
Selected Major Tax Expenditures in 2012, Compared with Other Categories of Revenues and Outlays (Percentage of GDP)
Some Ways to Reduce Tax Expenditures * Estimates from Reducing the Deficit: Revenue and Spending Options (March 2011). Estimate is for 2021.
Some Other Ways to Raise Taxes * Estimates from The Budget and Economic Outlook: Fiscal Years 2012 to 2022 (January 2012).Estimate for 2022. ** Rough calculation based on estimates from An Analysis of the President's Budgetary Proposals for Fiscal Year 2012 (April 2011) and The Budget and Economic Outlook: Fiscal Years 2012 to 2022 (January 2012).
Summary • To put the federal debt on a sustainable path, we need to change policies in significant ways. • All federal spending apart from Social Security, the major federal health care programs, and interest is on track to be smaller relative to GDP by 2022 than at any point in the past 40 years—and only about two-thirds of its average share of GDP during that period. • If that outcome is achieved, putting federal debt on a sustainable path still requires changes in Social Security, the major federal health care programs, and taxes that amount to about $750 billion in 2022.
Summary (cont.) To meet that target for 2022: • If we extend the expiring tax provisions (other than the payroll tax reduction) and index the AMT for inflation, as described in the alternative fiscal scenario, spending on Social Security and the major federal health care programs would need to be cut by about one-fourth. Because most such spending goes to people over age 65, a cut of that magnitude would represent a major change to the sorts of benefits provided for Americans when they become older. • If we do not change spending on Social Security and the major federal health care programs, tax revenue would need to be increased by about one-sixth. Such an increase would raise federal revenues significantly above their average share of GDP in the past several decades.
Summary (cont.) Our country faces fundamental choices about federal benefits and services and about the federal taxes needed to pay for them. Unless we cut federal spending apart from Social Security and the major health care programs below the unusually low share of GDP it is already projected to reach by the end of the coming decade, stabilizing federal debt relative to GDP will require us to cut spending on Social Security and federal health care programs by about one-quarter, raise taxes by about one-sixth, or do some combination of those approaches.