Download
1 / 17
170 likes | 242 Views
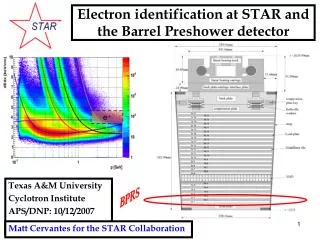
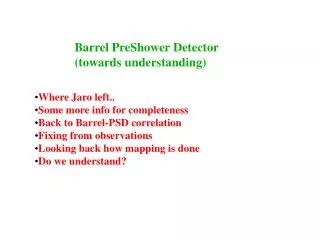
Barrel PreShower cal status. Where we have been Where we are Where we go. Jaroslav Bielcik Yale/BNL. expected:. 84% electrons shower before layer 2 6% hadrons shower before layer 2 electrons deposit larger energy. Motivation. integrated dep .energy in first 2 emc layers

E N D
Barrel PreShower cal status • Where we have been • Where we are • Where we go Jaroslav Bielcik Yale/BNL
expected: • 84% electrons shower before layer 2 • 6% hadrons shower before layer 2 • electrons deposit larger energy Motivation • integrated dep .energy in first 2 emc layers • to bemc tower we have bprs information • 2x60 modules totaly • 20x2 towers in module Electron Id should be improved Module side view Details http://www.star.bnl.gov/protected/heavy/bielcik/prs/preshower_cal.htm
Where we have beenTo do July 2004 • Check prs mapping • Understand prs/bemc/track correlations • Simulate deposit MIP particles ~ eta • Complete calibration • Determine improvement of electron Id
Problems to find MIP • Idea: project TPC tracks on BPRS and for those plot ADC spectra • Most tracks are hadrons => ADC spectrum corresponds to MIP • We expect to see difference: all ADC and MIP MIP ??? • However: no significant difference has been observed?!! PANIC • Trying a lot => no MIPs
MIPs in simulations • Looking in AuAu62 Hijing simulations to get a right feeling Clear visible MIPS position~energy Channel: 7-8 Deposit energy: 35-50 MeV Problem should be outside the MIP anal maybe map, maybe map … How to check?
Correlating BPRS signal around projected track position • Tpc track projected on BPRS tower (m,s,e) • check towers ADC>0 around this place 4x4 • marking them -4-4; 0 is proper position • Signal in tower 0 is expected to dominate
Spectra for all towers Sum over all towers shows that expected tower dominates WELL MAP seems to be OK. Let check each towers separately Tower “0” is not always dominating ???
Each tower separately Few towers make good job for rest (what about rest?)
Correlating BPRS and BTOW with maximum signal in event This is not a face of Holly Mary on toust but weak correlation How to interpret this? GOOD/BAD? Subhasis Method
Contributing towers to correlation ZOOM here we see something like grass => here rather like trees Contributing towers are groups of 4 towers => rest do not contribute Here we come to the core of the problem: BPRS map is not OK (the most probably) GOOD TOWERS: Id=9(10,11,12)+20*i .
MIPs with bad and good towers THIS IS MIP!!! GOOD TOWERS shows MIPs => that is very good news
To do Subhasis talk : shows that this was problem with MAP possible solution We can finnaly calibrate it NOW it is just peanuts! Study lepton ID improvement
BEMC geometry front view 60 emc modules module module module top view module side view
ETA MIP ADC MIP ENERGY (GeV) • e= 1 7.0305 0.0355 (+/- 0.0240) • e= 2 7.2614 0.0332 (+/- 0.0213) • e= 3 6.8939 0.0349 (+/- 0.0235) • e= 4 7.5919 0.0369 (+/- 0.0262) • e= 5 7.4255 0.0338 (+/- 0.0252) • e= 6 7.6160 0.0348 (+/- 0.0265) • e= 7 7.9097 0.0350 (+/- 0.0278) • e= 8 7.4636 0.0351 (+/- 0.0253) • e= 9 7.6321 0.0412 (+/- 0.0224) • e= 10 7.3018 0.0413 (+/- 0.0220) • e= 11 8.0859 0.0435 (+/- 0.0216) • e= 12 7.0524 0.0387 (+/- 0.0242) • e= 13 7.8205 0.0463 (+/- 0.0271) • e= 14 6.8425 0.0426 (+/- 0.0235) • e= 15 7.8134 0.0433 (+/- 0.0245) • e= 16 7.1765 0.0415 (+/- 0.0206) • e= 17 7.3744 0.0446 (+/- 0.0247) • e= 18 7.7141 0.0494 (+/- 0.0293) • e= 19 7.1439 0.0424 (+/- 0.0297) • e= 20 7.9555 0.0350 (+/- 0.0238)