Download
1 / 24
240 likes | 324 Views
AIDS Cases in Racial/Ethnic Minorities*. January 1986-June 1999, United States. 80. 25,000. 70. 20,000. 60. 50. 15,000. Percent of Cases. Number of Cases. 40. 10,000. 30. 20. 5,000. 10. 0. 0. 1986. 1987. 1988. 1989. 1990. 1991. 1992. 1993. 1994. 1995. 1996. 1997.

E N D
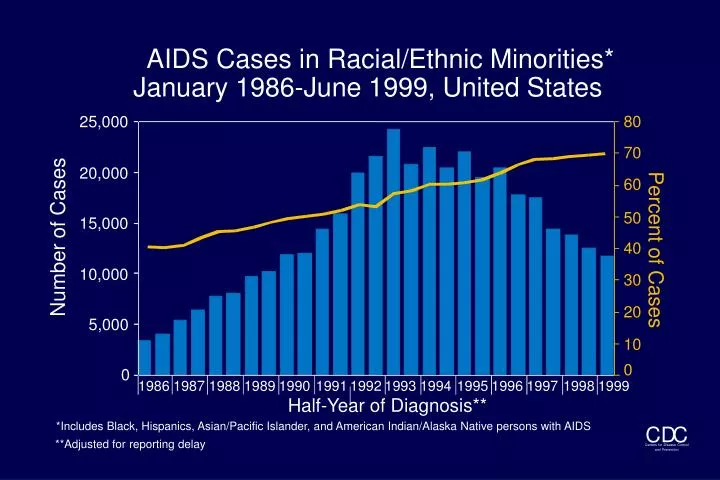
AIDS Cases in Racial/Ethnic Minorities* January 1986-June 1999, United States 80 25,000 70 20,000 60 50 15,000 Percent of Cases Number of Cases 40 10,000 30 20 5,000 10 0 0 1986 1987 1988 1989 1990 1991 1992 1993 1994 1995 1996 1997 1998 1999 Half-Year of Diagnosis** *Includes Black, Hispanics, Asian/Pacific Islander, and American Indian/Alaska Native persons with AIDS **Adjusted for reporting delay
AIDS Cases in Racial/Ethnic Minorities, January 1986-June 1999, United States The number of persons reported with AIDS to CDC increased each year from 1986 through 1994. In 1993, the definition of AIDS was expanded and this resulted in an artifactual increase in the number of AIDS cases reported. Beginning in 1996, the success of antiretroviral therapies, including protease inhibitors, has helped to reduce the progression to AIDS among persons infected with HIV.. The same incidence pattern has occurred among all racial/ethnic groups. Among minorities, the number of reported AIDS cases began to decrease in 1994 as the effect of the 1993 case definition began to wane ; however, the proportion of AIDS cases in minorities has continued to increase each year. In the first half of 1999, 11,745 cases of AIDS were reported among minority racial/ethnic groups and this accounted for 70 % of all reported cases of AIDS in 1999 in the United States.
Proportion of AIDS Cases, by Race/Ethnicity and Year of Report,1985-1999, United States 70 White, not Hispanic 60 s e s 50 a C Black, not Hispanic f 40 o t n 30 e Hispanic c r e P 20 American Indian/ 10 Asian/Pacific Islander Alaska Native 0 1985 1987 1989 1991 1993 1995 1997 1999 Year of Report
Proportion of AIDS Cases, by Race/Ethnicity and Year of Report, 1985-1999, United States The proportional distribution of AIDS cases among racial/ethnic groups has shifted since the beginning of the epidemic. The proportion of cases among whites has decreased over time, while it has increased among blacks and Hispanics. As of 1996, a greater proportion of cases was reported among blacks than among whites. The proportion of cases reported among Asian/Pacific Islanders and American Indian/Alaska Natives has remained relatively constant, representing approximately one percent of all cases. In 1999, 32% of reported AIDS cases were white, 47% were black, 19% Hispanic, 1% Asian/Pacific Islander, and less than 1% American Indian/Alaska Native.
AIDS in Blacks and Hispanics Of the 733,374 AIDS cases reported to CDC through 1999, Blacks and Hispanics accounted for 55% of total 77% of women 79% of heterosexuals* 82% of children Of AIDS cases reported in 1999, 67% were among Black and Hispanic adults and adolescents. *Heterosexual injection drug users and persons with heterosexually acquired HIV
AIDS in Blacks and Hispanics Blacks and Hispanics account for a disproportionate share of AIDS cases. Over half of the AIDS cases reported in the United States were among Black and Hispanics. Over three-fourths of the women and children reported with AIDS were Black or Hispanic. In 1999, 67% of the AIDS cases reported were among Black and Hispanic adults and adolescents.
AIDS Cases in Adult/Adolescent Men, by Exposure Category and Race/Ethnicity, Reported through 1999, United States 100 Men who have sex with men (MSM) 75 Injection drug use (IDU) MSM and IDU 50 Percent of Cases Heterosexual contact Other/not 25 identified* 0 Hispanic White Black American Indian/ Asian/Pacific not Hispanic not Hispanic Alaska Native Islander N=107,867 N=1,743 N=290,537 N=199,248 N=4,670 *Includes patients with hemophilia or transfusion-related exposures and those whose medical record review is pending; patients who died, were lost to follow-up, or declined interview; and those with other or undetermined modes of exposure
AIDS Cases in Adult/Adolescent Men, by Exposure Category and Race/Ethnicity, Reported through 1999, United States Over 600,000 cases of AIDS have been reported among adult/adolescent men; approximately one third among black men and 18% among Hispanic men. Overall, 56% of men reported with AIDS were men who have sex with men (MSM) and 22% were injection drug users (IDU). An additional 8% of cases were MSM and IDU. The distribution of risk varies by racial/ethnic group; among white men 75% of cases are among MSM and 9% are IDU. This is similar for Asian/Pacific Islander men. Among black men, 37% are MSM and nearly as many (34%) are IDU. This is similar for Hispanic men, with 43% MSM and 36% IDU. Among American Indian/Native American men 57% of reported cases are MSM, 16% IDU and 17% MSM and IDU.
AIDS Cases in Adult/Adolescent Women, by Exposure Category and Race/Ethnicity, Reported through 1999, United States 100 Injection drug use (IDU) 75 Sex partner of IDU Sex partner of 50 Percent of Cases other men at increased risk Other/not identified* 25 0 Hispanic Black Asian/Pacific American Indian/ White Alaska Native Islander not Hispanic not Hispanic N=23,831 N=358 N=629 N=26,298 N=68,529 *Includes patients with hemophilia or transfusion-related exposures and those whose medical record review is pending; patients who died, were lost to follow-up, or declined interview; and those with other or undetermined modes of exposure
AIDS Cases in Adult/Adolescent Women, by Exposure Category and Race/Ethnicity, Reported through 1999, United States Over 100,000 cases of AIDS have been reported among women since the beginning of the epidemic. Fifty-seven percent of the cases were among black women and 20% among Hispanic women. HIV infection was attributed to injection drug use (IDU) for 42% of the women reported with AIDS, and to heterosexual contact with either an IDU, a bisexual male, a person with hemophilia, a transfusion recipient with HIV, or an HIV-infected person for 40% of the women. These proportions are similar for white, black and American Indian/Alaska Native women, with each group reporting 42 to 46% of cases among IDU, 35 to 40% attributed to heterosexual contact and 14 to17% reported heterosexual contact with an IDU. More cases among Hispanic and Asian/Pacific Islander women were attributed to heterosexual contact (47 to 49%) of which 22% of Hispanic women reported sexual contact with an IDU and only 13% of the Asian/Pacific Islanders.
AIDS Cases in Adults and Adolescents by Exposure Category and Race/Ethnicity, Reported through 1999, United States White Black Hispanic not Hispanic not Hispanic Number % Number % Number % Exposure category Men who have sex with men (MSM) 216,564 68 74,434 28 45,867 35 Injection drug use (IDU) 37,930 12 97,550 36 47,951 36 14,965 7,253 6 8 6 MSM and IDU 23,880 Heterosexual contact 17,208 40,840 13 5 15 15,709 13,419 7 15 39,988 10 Other/not identified* 22,752 131,698 267,777 Total 316,835 *Includes patients with hemophilia or transfusion-related exposures and those whose medical record review is pending; patients who died, were lost to follow-up, or declined interview; and those with other or undetermined
AIDS Cases in Adults and Adolescents by Exposure Category and Race/Ethnicity, Reported through 1999, United States The majority of cases of AIDS reported among whites, Asian/Pacific Islanders, and American Indian/Alaska Natives have been among men who have sex with men (MSM). Among blacks, and Hispanics, injection drug use (IDU) has been the primary mode of exposure to HIV (36%). Of the 74,406 cases of AIDS (with a known race/ethnicity) attributed to heterosexual contact, 64% were among women. Over half of these women (25,719) were black. Since the beginning of the epidemic there have been 5,075 cases of AIDS among persons with hemophilia or coagulation disorders, and 8,531 cases attributed to the receipt of blood transfusions, blood components, or tissue. These cases have included persons of all racial and ethnic groups.
AIDS Cases in Adults and Adolescents by Exposure Category and Race/Ethnicity, Reported through 1999, United States Asian/Pacific American Indian/ Alaska Native Islander Exposure category Number % Number % Men who have sex with men (MSM) 3,389 64 987 47 Injection drug use (IDU) 351 7 437 21 14 3 295 MSM and IDU 172 8 174 9 Heterosexual contact 475 17 10 208 912 Other/not identified* Total 2,101 5,299 * Includes patients with hemophilia or transfusion-related exposures and those whose medical record review is pending; patients who died, were lost to follow-up, or declined interview; and those with
AIDS Cases in Adults and Adolescents by Exposure Category and Race/Ethnicity, Reported through 1999, United States The majority of cases of AIDS reported among whites, Asian/Pacific Islanders, and American Indian/Alaska Natives have been among men who have sex with men (MSM). Among blacks, and Hispanics, injection drug use (IDU) has been the primary mode of exposure to HIV (36%). Of the 74,406 cases of AIDS (with a known race/ethnicity) attributed to heterosexual contact, 64% were among women. Over half of these women (25,719) were black. Since the beginning of the epidemic there have been 5,075 cases of AIDS among persons with hemophilia or coagulation disorders, and 8,531 cases attributed to the receipt of blood transfusions, blood components, or tissue. These cases have included persons of all racial and ethnic groups.
AIDS Cases Reported in 1999 and Estimated 1999 Population, by Race/Ethnicity, United States AIDS Cases Population N=46,400* N=277,200,000 71% 32% <1% 1% 1% 47% 4% 19% 13% 12% White, not Hispanic Asian/Pacific Islander Black, not Hispanic American Indian/ Alaska Native Hispanic *Includes 120 persons with unknown race/ethnicity
AIDS Cases Reported in 1999 and Estimated 1999 Population, by Race/Ethnicity, United States In 1999, 46,400 cases of AIDS were reported to CDC. The distribution of cases among some racial/ethnic groups is disproportional to the distribution of the general population. Thirty-two percent of the cases were among white persons, whereas 71% of the population is white. Forty-seven percent of cases reported were among black persons, yet only 12% of the population is black. And 19% of cases were Hispanic, compared to 13% of the population. This is due to either a higher prevalence of behaviors among minority persons that place one at risk for HIV infection, or a higher prevalence of HIV infection within the minority population, or some combination of these factors.
Adult/Adolescent AIDS Rates per 100,000 Black Population Reported in 1999 45.6 * * * * 37.9 55.5 * * 29.7 * 180.3 MA 173.0 * 36.8 RI 81.2 29.1 131.1 20.8 CT 82.4 54.3 NJ 147.6 23.6 63.0 29.3 89.5 DE 107.4 70.3 36.9 32.1 MD 114.7 36.9 56.7 56.4 41.0 DC 266.3 45.4 61.1 74.5 * 18.5 25.1 Rate per 100,000 84.0 <50 39.6 77.7 36.5 50-99 100+ 67.4 56.0 * <5 cases * 182.1 US rate =84.2 N=21,730 27.1 Includes cases with unknown state of residence †
Adult/Adolescent AIDS Rates per 100,000 Black Population, Reported in 1999 State-specific AIDS rates for blacks range from 20.8 in Nebraska to 182.1 in Florida. In addition to Florida, rates are highest in states in the northeast that generally have high AIDS counts, such as New York, New Jersey, Maryland, Delaware, Massachusetts and Connecticut. The high rate for Washington, DC should be interpreted with caution as the other rates presented are for states, and Washington, DC is a city and the rate should be compared with other cities rather than other states.
Adult/Adolescent AIDS Rates per 100,000 Hispanic Population Reported in 1999 15.3 * * * * 15.7 31.8 NH 60.7 * 14.9 * 124.5 MA 127.3 * 15.9 RI 60.0 14.8 108.6 CT 89.2 17.6 24.7 NJ 43.6 20.0 19.3 12.2 32.3 DE 42.7 21.9 16.3 * MD 23.5 22.6 16.2 23.4 29.2 DC 112.2 25.6 32.5 25.4 6.6 7.8 32.3 * Rate per 100,000 <20 57.9 19.3 25.8 20-49.9 50+ 17.2 20.6 <5 cases * * US rate =34.6 43.2 P.R. 41.9 N=8,967 † 7.1 † Includes cases with unknown state of residence
Adult/Adolescent AIDS Rates per 100,000 Hispanic Population, Reported in 1999 The distribution of state-specific AIDS rates for Hispanics is similar to that for blacks. Generally, rates are highest in the northeastern states and lower in the northcentral states. These rates should be interpreted with caution, as in many states a relatively high rate is more indicativeof a small Hispanic population than a large number of AIDS cases. New York, Connecticut, Pennsylvania, and Massachusetts have the highest rates.
Adult/Adolescent AIDS Rates per 100,000 White Population Reported in 1999 6.1 1.3 7.0 1.2 3.1 7.7 3.0 NH 3.5 2.5 1.9 2.4 13.1 MA 15.4 2.8 3.3 RI 7.1 3.0 6.3 CT 10.3 3.6 13.1 NJ 8.9 3.5 7.0 5.5 7.6 DE 11.7 17.7 7.7 3.6 MD 7.3 5.8 6.9 6.5 5.8 DC 70.9 3.7 8.6 20.6 6.7 3.9 6.2 Rate per 100,000 8.7 <5 7.9 7.0 5.5 5-9.9 10+ 13.1 10.1 <5 cases * * 19.6 US rate =9.0 21.1 N=14,813 † Includes cases with unknown state of residence †
Adult/Adolescent AIDS Rates per 100,000 White Population, Reported in 1999 In 1999, the highest state-specific AIDS rates for whites were in Hawaii, Florida, Arizona, California, Massachusetts, New York, Texas, and Nevada. The rates in general, however, are considerably lower than those for blacks or Hispanics, with an overall U.S. rate of 9.0 per 100,000 population, compared with 84.2 for blacks and 34.6 for Hispanics.
AIDS Cases in Adults and Adolescents, by Sex and Race/Ethnicity, Reported in 1999, United States 16 14,946 White, not Hispanic 14 12,855 Black, not Hispanic 12 Hispanic Asian/Pacific Islander 10 American Indian/ Number of Cases (in thousands) Alaska Native 8 7,019 6,784 6 4 1,924 1,948 2 303 40 63 136 0 0 Male Female N=35,357* N=10,780* *Includes cases with unknown race/ethnicity
AIDS Cases in Adults and Adolescents, by Sex and Race/Ethnicity, Reported in 1999, United States In 1997, 77% of reported AIDS cases were male. Similar numbers of white and black men were reported with AIDS, and about half as many Hispanic men. Sixty-three percent of cases among women were black, and nearly equal numbers of white and Hispanic women were reported with AIDS. Relatively few cases of AIDS were reported among Asian/Pacific Islander and American Indian/Alaska Natives in 1999.