Download

1 / 21
220 likes | 476 Views
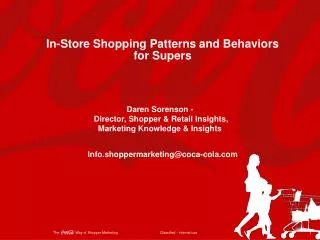
In-Store Shopping Patterns and Behaviors for CR. Daren Sorenson - Director , Shopper & Retail Insights, Marketing Knowledge & Insights. Info.shoppermarketing@coca-cola.com. Convenience Retail Video PathTracker ® Shopper Shopper Behavior Study. November 2006.

E N D
In-Store Shopping Patterns and Behaviors for CR Daren Sorenson - Director, Shopper & Retail Insights, Marketing Knowledge &Insights Info.shoppermarketing@coca-cola.com
Convenience RetailVideo PathTracker® Shopper Shopper Behavior Study November 2006 Strictly Confidential: For Internal Use Only
Study Objectives Study Methodologies Shopper Intercepts Video PathTracker® Key Insights Action Items Table of Contents
Gain a deeper understanding of the motivators, influencers, and overall Conv. Retail shopping behavior: How do shoppers shop the Convenience Retail Channel? How do they shop for non-alcoholic, ready-to-drink beverages? What factors influence shopper behavior? Study Objectives
An in-store, quantitative shopper intercept study Two Markets: Denver (Pepsi Heartland) and Dallas (Coke Heartland) 345 consumers were observed and then interviewed after they were seen purchasing a beverage. Consumers who only bought an alcoholic beverage, hot coffee, or gas were not interviewed (90%-95% confidence level) Observations: Sections shopped Time spent shopping/buying Package interaction Shopping party composition Interviews: Product(s) purchased Reason for purchase decision Influences Shop-ability Purchase decision process Shopper Intercept Methodology
Video PathTracker® was conducted in two stores in June, 2005 Dallas Denver Eight small video cameras were installed to record shopping behavior for a week In total, over 250 shopping trips were recorded in each of two stores The specific trips mapped were randomly selected from each of the following times and groups: Weekdays and weekend days Morning/noon (6:00 AM – 2:00 PM) Afternoon/evening (2:00 PM – 11:00 PM) Video PathTracker® Methodology Small video cameras were installed in each store Mapping technicians review digital video footage and map shopper behavior
Store Format Drives Traffic Patterns Get Shoppers to the Cold Vault and They Will Buy Up to 30% of Beverage Purchases are Up for Grabs Shopping Must Be Made Easy The Last 25% of the Trip Can Generate FC Purchases Only 19% of Shoppers Purchase Food & Beverage Key Insights
Convenience Retail shopper traffic patterns are based mainly on store design vs. Supermarkets which are typically counter clockwise 70% of shoppers visit at least ½ of the store Approximately 60% actively shop the store Placement of merchandising materials/signage and secondary placement of beverages will be exposed to most shoppers Store Format Drives Traffic Patterns New Concept Format Traditional Format Fountain Beer Cold Vault CSD Cold Vault Fountain High Density Beer Cold Vault Low Density CSD Cold Vault Entrance Entrance Implication:Every store will behave differently – however, using common similarities in traffic can provide product placement and messaging guidance (i.e. strike zones) Note: Visit is defined as a shopper moving past a product or category. Shop is defined as a shopper stopping in front of a product or category. See appendix for visit and shop information Source: 2005 Video PathTracker Study
Get Shoppers to the Cold Vault and They Will Buy Implication:The Cold Vault has the ability to convert the most traffic to actual purchases Source: 2005 Video PathTracker Study
Switched planned purchases and impulse purchases prove that in-store messaging/activity is important 11% impulse purchases + 18% Switched Planned Purchase = 29% In-Store Opportunity NCB and CSD purchasers make different planned decisions 81% of shoppers always buy the same type of beverage, 59% package type (bottle, can, fountain), 63% flavor, 51% brand, and 52% size Up To 30% of Beverage Purchases are Up for Grabs • CSD • Brand • Type • Price • Package Size • Type of Package • NCB • Type • Package Size • Brand • Price • Type of Package Planned Purchase Hierarchy Ranking Note: The Purchase Decision Hierarchy was developed based on the top three things a shopper considered prior to purchase Implication:The ability to impact package size in-store through pricing and other package characteristics could provide revenue and profit upside Source: 2005 Shopper Intercepts
Shopping Must Be Made Easy The average convenience retail shopping trip is 2.6 minutes long Time spent in the store must be well used as it pertains to purchase Shoppers spend longer in-store in the traditional format and they purchase more Congestion from ‘structural bottlenecks’ or high traffic can frustrate shoppers Primary congestion points are around the checkout and surrounding vicinity = High congestion potential New Concept Format Traditional Format The whole right side of the store as well as the fountain area show High Congestion and Slow Movement The main area for “High Congestion with Slow Movement” is at the checkout/front counter Implication:Navigational ease throughout the store can drive shopping enjoyment and purchase potential Note: The congestion map key should be read with the first coordinate being level of congestion and the second coordinate being the speed of shoppers Source: 2005 Video PathTracker Study
The Last 25% of the Trip Can Generate FC Purchases Most shoppers are beginning – not ending - their trips at the FC display section Traditional Format End of Trip New Concept Format Start of Trip FC Display FC Display Purchase Motivations A vast majority of CSD buyers are motivated by thirst and will likely head to Cold Vault or Fountain Implication:Impulse, stock up items that are heavy to carry around have a stronger likelihood of being picked up later in the trips after planned items have been selected Source: 2005 Video PathTracker Study
Only 19% of Shoppers Purchase Both a Food Item & Beverage on the Same Trip Combined beverage and food shoppers spend more than the average Convenience Retail shopper... ...unfortunately, the combined shopper represents only 19% of total shoppers Implication: NARTDBeverages can help drive overall purchasing and subsequently profit, thus requiring premium messaging and store placement Source: 2005 Shopper Intercept s
Insights and Actions Actions Key Insights Store format drives traffic patterns • Intercept shoppers with right product and package availability at right placement Utilize strike zones for merchandising or promotion but message stopping power must be strong (Entrance, Cold Vault, Restrooms, Pathway To Checkout and Checkout) • Long-Term: Develop relationship to become valued, involved partner in future store design Activate proximity marketing programs to drive shoppers in-store, to NARTD section, and to cold vault Get shoppers to the cold vault and they will buy Up to 30% of beverage purchases are “up for grabs” • Optimize key purchase drivers • Maximize impulse purchasing among those who buy a food or snack item. • Test packaging scenarios (availability and activation) • Leverage packaging innovation in store placement and messaging • Improve FC impulse purchases by placing multi-packs at the end of the shopping trip
Insights and Actions Actions Key Insights Shopping must be made easy High purchase items need to be easy to find and located in the first ½ of the store Position FC packages into end of shopping trip strike zones: primary aisle to checkout and checkout The last 25% of the trip can generate FC purchases Only 19% of shoppers purchase both food item & beverage on the same trip • Drive purchase incidence and higher average transactions by developing bundled programs Create signage in both beverage and food locations
Fountain Cold Vault Entry Multi-Pack CSDs Traditional Format Store Layout
Cold Vault (NABs) Fountain Cold Vault (Beer) Multi-Pack CSDs Entry New Concept Format Store Layout
How Much of the Store Do They Visit? Placement of merchandising materials/signage and secondary placement of CSDs will be exposed to most shoppers Store coverage in New Concept Format and Traditional is good, with most shoppers visit at least half of the store 71% Visit More Than Half 69% Visit More Than Half
Shopper Intercept Methodology An in-store, quantitative shopper intercept study Two Markets: Denver and Dallas 345 consumers were observed and then interviewed after they were seen purchasing a beverage Observations: Sections shopped, time spent shopping/buying, package interaction, shopping party composition Interviews: Product(s) purchased, reason for purchase decision, influences, shopability, purchase decision process Overview of Methodologies • Video PathTracker® Methodology • Eight small video cameras were installed to record shopping behavior for a week in two stores in June 2005 • Over 250 shopping trips were recorded in each of two stores • The specific trips mapped were randomly selected from various dayparts and day of the week
THANK YOU For additional information please visit the Shopper/Customer Marketing Community at www.KOSCMarketing.com