Download
1 / 6
60 likes | 75 Views
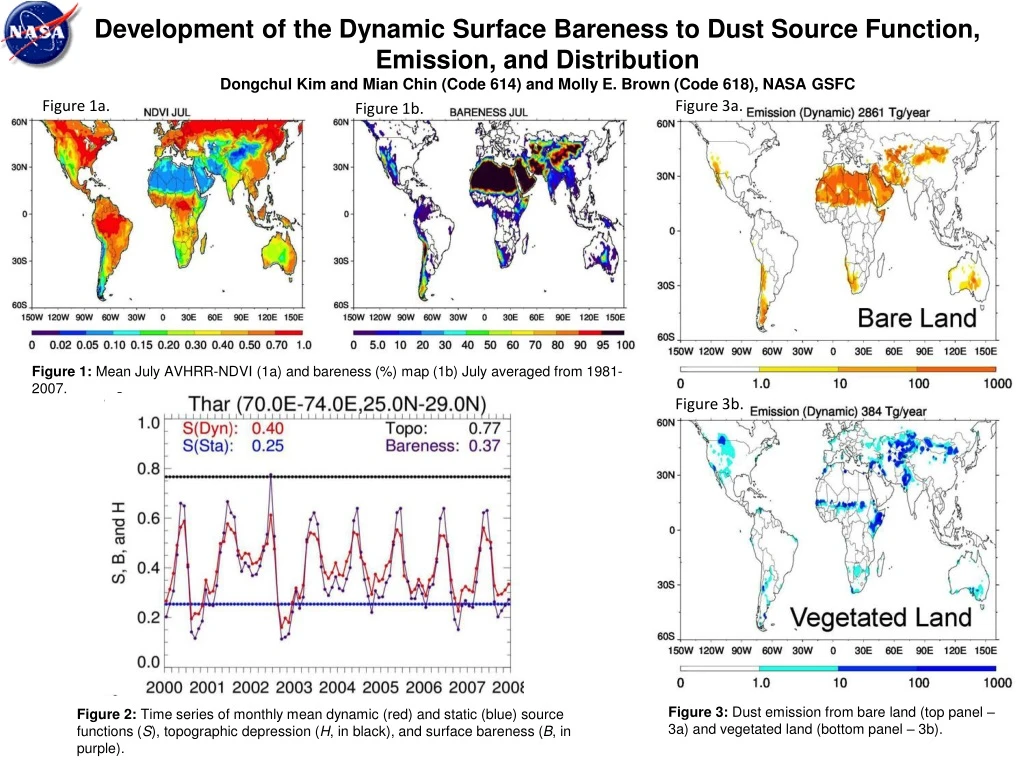
This study reports the development of a time-dependent global dust source and its impact on dust simulation in the GOCART model. Surface bareness was determined using the AVHRR-NDVI satellite data, and a dynamic dust source function was constructed based on this information.

E N D
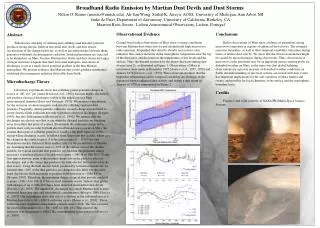
Development of the Dynamic Surface Bareness to Dust Source Function, Emission, and Distribution Dongchul Kim and Mian Chin (Code 614) and Molly E. Brown (Code 618), NASA GSFC Figure 1a. Figure 3a. Figure 1b. Figure 1: Mean July AVHRR-NDVI (1a) and bareness (%) map (1b) July averaged from 1981-2007. Figure 3b. Figure 3: Dust emission from bare land (top panel – 3a) and vegetated land (bottom panel – 3b). Figure 2: Time series of monthly mean dynamic (red) and static (blue) source functions (S), topographic depression (H, in black), and surface bareness (B, in purple).
Name:Dongchul Kim and Mian Chin (Code 614) and Molly E. Brown (Code 618) , NASA/GSFC E-mail: dongchul.kim@nasa.gov Phone: 301-614-6972 Abstract: We report the development of a time dependency of global dust source and its impact on dust simulation in the Goddard Chemistry Aerosol Radiation and Transport (GOCART) model. We determine the surface bareness using the 8 km Normalized Difference Vegetation Index observed from the Advanced Very High Resolution Radiometer satellite (AVHRR-NDVI). References: Kim, D., M. Chin, H. Bian, Q. Tan, M. Brown, T. Zheng, R. You, T. Diehl , P. Ginoux, T. Kucsera, 2012, The Effect of the Dynamic Surface Bareness on Dust Source Function, Emission, and Distribution, J. Geophy. Res. (accepted) Data Sources: In this study, we utilized the AVHRR NDVI composite from the NASA Global Inventory Monitoring and Modeling Systems (GIMMS) (Tucker et al., 2005; Brown et al., 2006). Technical Description of Figures: Figure 1: Mean July AVHRR-NDVI and bareness (%) map July averaged from 1981-2007. Figure 2: Time series of monthly mean dynamic (red) and static (blue) source functions (S), topographic depression (H, in black), and surface bareness (B, in purple). Thar desert is one of several regions over the globe that is sensitive to the dynamic dust source function. Figure 3: Dust emission from bare land (top panel) and vegetated land (bottom panel). Scientific significance: This NDVI-based surface bareness map is used, along with the soil and topographic characteristics, to construct a dynamic dust source function for simulating dust emissions with the GOCART model. 22 studied dust source regions are fall into three groups of (I) permanent desert, (II) seasonally changing bareness that regulates dust emissions, and (III) seasonally changing bareness that has little effects on dust emission. Compared with the GOCART results with the previously employed static dust source function, the simulation with the new dynamic source function shows significant improvements in category (II) regions. Relevance for future science and relationship to Decadal Survey: With the dust emission calculated from the new dynamic dust source function, we have estimated that globally 88 % of dust is emitted from the bare land. Although the vegetated land, such as grassland and crop area, is a minor source of dust emission (12 %), they are most susceptible to the change of human activities and climate. Therefore, using the NDVI-based technique may develop a projection of future dust emission from the land cover and land use change scenarios.
First flight of Goddard RF Explorer (GREX) Airborne RFI Surveyor Edward Kim, Albert Wu,, Tammy Faulkner, and Pete Young, Code 617, NASA GSFC Lynn Miles, Mark Wong, and Damon Bradley, Code 564, NASA GSFC Mechanical Systems Branch at Wallops, Code 548, NASA GSFC Atlantic Ocean NASA Wallops Figure 2: (above) GREX system on board the NASA Wallops P-3 aircraft (below) during October 6, 2012 first flight . Antenna is mounted in the round window. A typical signal can be seen on the computer display. Figure 1: (above) Red areas indicate L-band (1.4 GHz) Radio Frequency Interference (RFI) observed since July 2012 by ESA SMOS satellite making most of Europe un-observable. NASA’s SMAP & Aquarius missions use/will use the same frequencies. Figure 3: (left) White lines indicate flight path along and offshore the US East Coast—excellent hunting grounds for interference signals. The flight started & ended at NASA Wallops.
Name: Edward Kim, NASA/GSFC, Code 617 E-mail: ed.kim@nasa.gov Phone: 301-614-5653 Abstract: A new Goddard tool for addressing Radio Frequency interference (RFI)—an issue for the wide range of science dependent on microwave observations—had its inaugural flight October 6, 2012. Real-world data from the Goddard RF Explorer (GREX) will be increasingly indispensible to preserve and improve that science. References: ESA story on latest RFI impact on SMOS mission http://www.cesbio.ups-tlse.fr/SMOS_blog/?tag=rfi NOAA needs for radio spectrum http://www.osd.noaa.gov/TPIO/Freq_Mang/freq_mang.html WMO needs for radio spectrum http://www.wmo.int/pages/prog/www/TEM/WMO_RFC/index_en.html Data Sources: GREX data from GREX instrument. Aircraft flight path data from NASA Wallops. Technical Description of Figures: Figure 1: Probability of sustained hard RFI occurrences (no outliers detection) for 20120912 + 07 days period from BB post-processing of OPER/REPR SML2 UDP & DAP-ASCENDING only passes-Dual & Full polarizations products.The red areas indicate the strongest RFI observed at L-band from ESA’s SMOS mission. Since July 2012, a new source appeared in Poland making soil moisture across most of Europe un-observable . NASA’s SMAP & Aquarius missions use/will use the same frequency. The red RFI areas in China and the middle East have been persistent for some time. Chinese authorities are reportedly under pressure to clean up RFI in China so their own remote sensing satellites can be more effective over Chinese territory. Figure 2: The GREX system as installed on the NASA Wallops P-3 aircraft during GREX’s October 6, 2012 first flight . An antenna mounted in the round window provided a view of RFI sources as the plane flew its course. A typical live GREX signal can be seen on the computer display. Figure 3: The flight path went along and offshore the US East Coast—excellent hunting grounds for interference signals. Scientific significance: The Earth’s Water Cycle is strongly linked by fundamental energy-matter interaction physics to phenomena observable by microwave remote sensing. For example, soil moisture observing is best done with passive microwave sensors. However, the optimal frequencies near 1.4 GHz (L-band) are subject to illegal RFI sources within the protected science spectrum band as well as to leakage from signals in nearby bands. Technology and algorithms are being developed to identify and excise the man-made RFI signals from the science signal, but this relies on characterizations of real-world RFI signals. GREX is a state-of-the-art tool for collecting such real-world RFI signals. During GREX’s first flight on October 6, 2012, it was configured to record real-world RFI at the 1.4 GHz band for use in developing RFI algorithms for NASA’s upcoming SMAP mission—the first mission to include an on-board dedicated RFI processor. Another example is the satellite microwave sounders like ATMS on Suomi-NPP. Microwave sounders provide the highest-impact observations for operational weather forecasts, and they are also impacted by RFI. Relevance for future science and relationship to Decadal Survey: RFI is already affecting many microwave instruments in orbit, and the trend is for RFI more often and at new microwave frequencies. Radio astronomy also suffers from RFI. Nearly all future microwave missions have begun considering how to deal with RFI, and future microwave missions that do not will be accepting additional risk—especially those that depend on finer-accuracy science measurements. Astronomers and Earth scientists participate in the international RF spectrum oversight process through the International Telecommunications Union (ITU), and major stakeholders like NASA, ESA, and the World Meteorological Organization (WMO) play an active role. However, RFI will continue to be a dynamic issue, and tools like GREX that can collect vital real-world RFI data will be increasingly indispensible to preserve and improve the science that depends on microwave observations.
Enhancing the USDA’s Global Crop Production Decision Support System with NASA’s Water Cycle Satellite Observations John D. Bolten, Code 617, NASA GSFC Figure 1: Seasonal cycles of the rank correlation between open loop and EnKF soil moisture anomalies with future vegetation anomalies (1 month) averaged within the Extra-tropical Northern (ETNH; to 60° N) and Southern (ETSH; to 60° S) Hemispheres. Figure 3: Comparisons between Rs(L)OL2 and Rs(L)EnKF2 over a range of L (i.e., 0 to 6 months) for sparsely-instrumented countries with moderate-to-severe food security issues. ΔR Figure 2: Global analysis of the net impact of assimilating AMSR-E soil moisture into the USDA water balance model.
Name: John Bolten, NASA/GSFC, Code 617 E-mail: john.bolten@nasa.gov Phone: 301-614-6529 Abstract: The added value of satellite-based surface soil moisture retrievals for agricultural drought monitoring is assessed by calculating the lagged rank correlation between remotely-sensed vegetation indices and soil moisture estimates obtained both before and after the assimilation of surface soil moisture retrievals derived from the Advanced Microwave Scanning Radiometer-EOS (AMSR-E) into a soil water balance model. Higher soil moisture/VI lag correlations imply an enhanced ability to predict future vegetation conditions using estimates of current soil moisture. References: Bolten, J. D., and W. T. Crow (2012), Improved prediction of quasi-global vegetation conditions using remotely-sensed surface soil moisture, Geophys. Res. Lett., 39, L19406, doi:10.1029/2012GL053470. Data Sources: Surface soil moisture retrievals are obtained from gridded 0.25° Land Parameter Retrieval Model (LPRM) products provided by VU University Amsterdam based on Advanced Microwave Scanning Radiometer-EOS (AMSR-E) brightness temperature products between June 2002 and December 2010 [http://www.falw.vu/~jeur/lprm/.] MODIS MCD12C1 land cover classification data obtained from the NASA Land Processes Distributed Active Archive Center (2010), MODIS MCD12C1 (Collection 5). USGS/Earth Resources Observations and Science (EROS), Sioux Falls, South Dakota. (MODIS) MOD13C2 product obtained from the NASA Land Processes Distributed Active Archive Center (2011), MODIS MYD13C2 (Collection 5). USGS/Earth Resources Observations and Science (EROS), Sioux Falls, South Dakota. Technical Description of Figures: Figure 1: Seasonal trends of spatially-averaged rank correlation Rs(L) of the USDA FAS 2-layer Palmer model open loop (θOL2) and the EnKF-based run using assimilated AMSR-E soil moisture estimates with monthly MODIS NDVI when soil moisture precedes NDVI by one month, (i.e., L=-1). Figure 2:Difference in rank correlation (Rs) between the USDA FAS 2-layer Palmer model open loop (θOL2) and the EnKF-based assimilation of AMSR-E soil moisture estimates into the the USDA FAS 2-layer Palmer model. In this figure, the rank correlation is calculated between monthly soil moisture and NDVI when soil moisture precedes NDVI by one month. Figure 3:Rs(L)OL2 and Rs(L)EnKF2 results averaged within six countries in Africa and Southern Asia with moderate to severe food security issues for L=0 to -6. Scientific significance: Resulting from this project, the USDA Foreign Agricultural Service (FAS) is implementing an improved soil moisture product in order to yield improvements in their crop forecasting system. The application of satellite-based soil moisture estimates (previously from AMSR-E and now from SMOS) into the FAS soil moisture model provides significant improvements to vegetation forecasting skill in several areas of the world, particularly areas lacking adequate rain gauge coverage (e.g. Afghanistan) required to characterize rainfall inputs into a soil water balance model. Relevance for future science and relationship to Decadal Survey: In preparation for the upcoming Decadal Survey mission, Soil Moisture Active Passive (SMAP), it is essential that we investigate new methods of applying and validating the utility of remotely-sensed soil moisture.