Download
1 / 31
310 likes | 444 Views
Optical and IR Imaging of Galaxy Clusters using NOT - NORDFORSK Summer School 2006. Elisabet Leitet Laia Mencía Trinchant Tine Bjørn Nielsen Carina Persson Tom Speltincx Supervisor: Tomas Dahlén. Outline. Aim Introduction: The beginning... Stars – galaxies - clusters

E N D
Optical and IR Imaging of Galaxy Clusters using NOT - NORDFORSK Summer School 2006 Elisabet Leitet Laia Mencía Trinchant Tine Bjørn Nielsen Carina Persson Tom Speltincx Supervisor: Tomas Dahlén
Outline • Aim • Introduction: • The beginning... Stars – galaxies - clusters • Luminosity function • Radial distribution of spectral types • Photometric redshift - method • Observations • Reductions • Summary – results
Aims • Plan and perform optical and infrared imaging • Reduce the data • Science: Clusters of galaxies
Why study Galaxy clusters? • Great cosmological importance: • formation and evolution of large scale structures • constrain cosmological parameters • galaxy interactions • evolution of galaxies
How ? • Use photometric redshift method to determine cluster membership of the galaxies and spectral type • → radial distribution of different spectral types • → luminosity function (LF) of different spectral types and total LF of the cluster
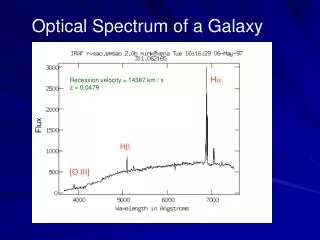
Spectroscopic: Identify and measure the shift of individual lines Narrow bands → long exposure time For galaxy clusters: multi-object spectrograph Only bright galaxies are reached Small errors: σz~0.01 Photometric: Use strong features in spectra (4000 Å break) Broad band color imaging (UBVRIJHK) → shorter exposure time Many more objects can be observed and measured simultaneously Possible to reach much fainter galaxies Larger errors: σz~0.1 How to determine redshifts?
Photometric redshift: The method • We use the Spectral Energy Distribution (SED)-fitting technique to determine the redshifts: • A library of template spectra is created. • These are redshifted and corrected for extinction • Compared with the observed colors to determine the redshift z that best fits the observed colors. • Drawbacks using this method: • Color/redshift degeneracies and template incompleteness. • Solution: Increase the number of filters.
IDL code • Compares observations with templates • Gets redshift AND type • Selection of objects to include • Type and redshift distribution • Number of stars in field • …
Observations: Planning • Clusters chosen for: • high position on the sky • low airmass • no presence of bright stars • intermediate redshift • too close does not fit in the field of view • too far away is too faint • Standards close enough to the cluster to have the same airmass • Optical: Landolt et al. 1992 • IR: Persson et al. 1998
Observations planning:Target: ZwCl2101.6+1351 • Coordinates: RA: 21 04 53 Dec: +14 01 30 • Redshift: z = 0.20 • Cluster diameter: 17 arcmin
Observations planning:Target: Abell 2100 • Coordinates: RA: 15 36 22 Dec: +37 38 09 • Redshift: z = 0.15 • Cluster diameter: 20 arcmin
Observations: Instruments • Optical • ALFOSC • 6.5x6.5 arcmin, • 0.19 arcsec/pixel • Filters: B V R • Infrared • NOTCam • wide field imaging, • 4x4 arcmin, • 0.23 arcsec/pixel • Filters: J Ks
S/N calculator For an elliptical galaxy we find the ratio B : V : R = 7.2 : 1.8 : 1 3h in total gives: 6400s in B-band 1440s in V-band 720s in R-band Outcome ZwCl (54%) 3300s in B-band 900s in V-band 450s in R-band Abell2100 (100%) 6400s in B-band 1440s in V-band 720s in R-band Optical observations
We find the ratio J = 28 % (= 2800s) Ks = 72 % (= 7200s) From the frame command Outcome ZwCl (114%) 4720s in Ks-band 2208s in J-band Abell2100 (115%) 2160s in Ks-band 1344s in J-band IR observations
Reductions: Optical • Raw image of ZwCl, taken in the B band Corrected for: • Bias offset • Bad pixels (mask) • Trimmed Corrected for: • Flat field Final image: • Normalized • Rotated • Aligned • ZP corrected • Combined • Galactic extinction corrected
Reductions: Near IR • Raw image of Abell 2100 taken in the Ks band Corrected for: • Sky Corrected for: • Flat field Final image: • Normalized • Aligned • Trimmed • ZP corrected • Combined • Galactic extinction corrected
Reductions: Zero Point Corrections • Corrections for atmospheric extinction, ca • ccdproc on standard stars (bias, flat, mask, overscan + trim section) • Normalized by exposure time • Magnitudes from SExtractor • Zpx=magx-magx,measured • ca=100.4k(AM-1) ,(k=slope) re B V R
Type distribution • Types • ellipticals • spirals (2 types) • SB (3 templates) • All galaxies in the field • Mostly ellipticals, as expected
Redshift distribution • Peaks around expected z (cluster) • Spread distribution lack of colours • fig.1 high peak R is the last band, results not reliable (z>1)
Redshift distribution, ellipticals • Plot per object probability of type and z based on our data • Degeneracy spirals vs. ellipticals • lack of colours
Radial distribution • Number of galaxies in the field • 1/3 galaxies cluster • Early- & late-types same density distribution, without cluster amount of ellipticals decreases 20% • Cluster early-types more abundant in the inner part • late-types rare, increasing towards outskirts
Number counts vs. Magnitude • Limiting magnitude • B = 25.8 • V = 24.5 • R = 23.6 • Including all galaxies in the field • For cluster galaxies LF
Number counts vs. Magnitude • Limiting magnitude • B = 25.4 • V = 24.2 • R =23.3
Future • LF • Scale NOTCam images to ALFOSC • Include IR observations (reduction done) • Redo photometric redshifts • More observations in optical and IR • Publish an article (if we are lucky enough) • …
Thanks NORDFORSK!!! After two weeks of standard.sex, group.sex and deep.sex, we’re back to cyber.sex… Sleep tight! zzzzzzzz...