Download
1 / 3
30 likes | 122 Views
1. Mui Wo River (Southern WCZ). Excellent. Excellent. Excellent. Excellent. Excellent. Good. Good. Good. Good. Water Quality Index. Fair. Fair. Fair. Fair. Bad. Bad. Bad. Bad. Very Bad. Very Bad. Very Bad. Very Bad. Year.

E N D
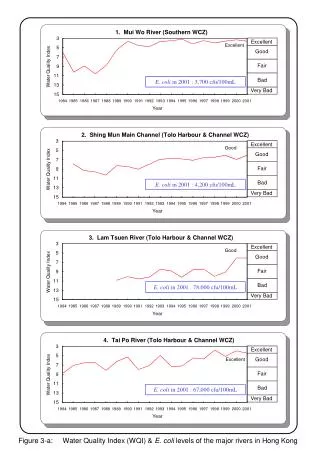
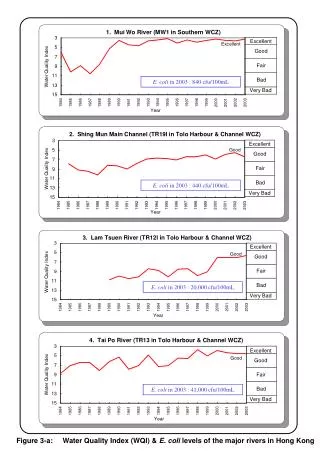
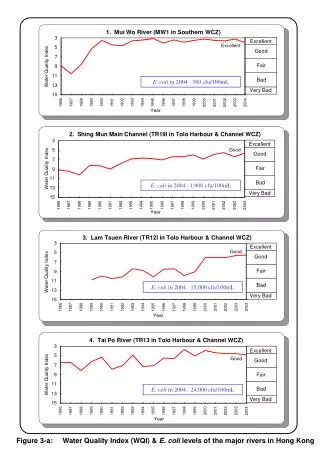
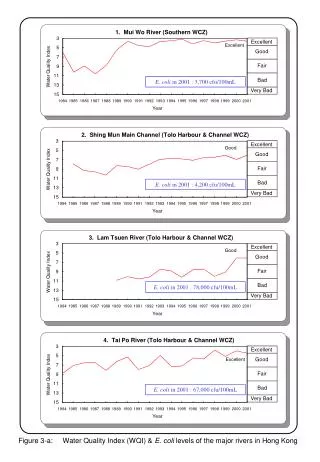
1. Mui Wo River (Southern WCZ) Excellent Excellent Excellent Excellent Excellent Good Good Good Good Water Quality Index Fair Fair Fair Fair Bad Bad Bad Bad Very Bad Very Bad Very Bad Very Bad Year 2. Shing Mun Main Channel (Tolo Harbour & Channel WCZ) Good Water Quality Index Year 3. Lam Tsuen River (Tolo Harbour & Channel WCZ) Good Water Quality Index Year 4. Tai Po River (Tolo Harbour & Channel WCZ) Excellent Water Quality Index Year E. coli in 2001 : 3,700 cfu/100mL E. coli in 2001 : 4,200 cfu/100mL E. coli in 2001 : 78,000 cfu/100mL E. coli in 2001 : 67,000 cfu/100mL Figure 3-a: Water Quality Index (WQI) & E. coli levels of the major rivers in Hong Kong
5. Ho Chung River (Port Shelter WCZ) Excellent Excellent Excellent Excellent Excellent Good Good Good Good Water Quality Index Fair Fair Fair Fair Bad Bad Bad Bad Very Bad Very Bad Very Bad Very Bad Year 6. Tuen Mun River (North Western WCZ) Good Water Quality Index Year 7. Sam Dip Tam Stream (Victoria Harbour WCZ) Excellent Water Quality Index Year 8. Yuen Long Creek (Deep Bay WCZ) Water Quality Index Bad Year E. coli in 2001 : 9,100 cfu/100mL E. coli in 2001 : 31,000 cfu/100mL E. coli in 2001 : 20,000 cfu/100mL E. coli in 2001 : 1,300,000 cfu/100mL Figure 3-b: Water Quality Index (WQI) & E. coli levels of the major rivers in Hong Kong
9. River Ganges (Deep Bay WCZ) Excellent Excellent Excellent Excellent Good Good Good Good Water Quality Index Bad Fair Fair Fair Fair Bad Bad Bad Bad Very Bad Very Bad Very Bad Very Bad Year 10. River Indus (Deep Bay WCZ) Water Quality Index Fair Year 11. River Beas (Deep Bay WCZ) Fair Water Quality Index Year 12. Kam Tin River (Deep Bay WCZ) Water Quality Index Bad Year E. coli in 2001 : 120,000 cfu/100mL E. coli in 2001 : 150,000 cfu/100mL E. coli in 2001 : 42,000 cfu/100mL E. coli in 2001 : 6,500 cfu/100mL Figure 3-c: Water Quality Index (WQI) & E. coli levels of the major rivers in Hong Kong