Download
1 / 59
620 likes | 748 Views
Public Health Nutrition 531 University of Washington Winter 2012. Farm-to-School . Outline & Presenters. Introduction, Methods and Sample Diana Reid Survey Results Carrie Dennett, Zhongyuan Liu & Melissa Edwards State Comparisons Erin Enriquez Best Evidence/Recommendations

E N D
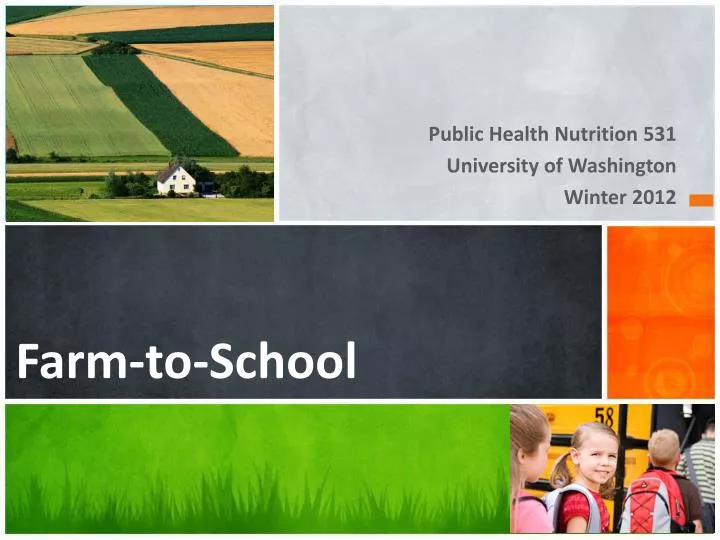
Public Health Nutrition 531 University of Washington Winter 2012 Farm-to-School
Outline & Presenters • Introduction, Methods and Sample • Diana Reid • Survey Results • Carrie Dennett, ZhongyuanLiu & Melissa Edwards • State Comparisons • Erin Enriquez • Best Evidence/Recommendations • Allison Parker & Elizabeth Aong • Conclusions • Cole Schindler
Methods The survey • Developed by WSDA staff along with WA State OSPI Child Nutrition Program and Oregon Dept. of Agriculture Farm to School Program • Sent to 295 school districts • 39 survey questions covering topics ranging from current practices and capacity to barriers and need for technical assistance. The analysis • Descriptive analysis of sample and survey responses. • Statistical comparison of key findings with demographic characteristics of school districts (chi-square test). • Comparison of current survey with Farm to School surveys from other states. • Review of literature to identify policies and practices that best support the Farm to School initiative. • Review of research papers, case studies and surveys to determine successful activities and policies implemented by other states. • Analysis of survey in terms of its structure and sectioning.
Foods currently being used and those that schools are interested in
4 of the top 10 fruits and veggies listed by school directors are also part of the top 10 commodity crops grown in Washington • Apples • Pears • Potatoes • Grapes • Very conducive to being purchased locally • Economical and logistical benefits
Interconnecting the Data • The majority of the top 10 whole and minimally processed fruits and vegetables – blueberries, strawberries, lettuce, broccoli, carrots, salad mix, corn, cauliflower, apples, pears, grapes – that were purchased by schools in the 2009-2010 school year were also the top fruits and vegetables that schools would be willing to purchase from a local source. • Lots of overlap between what the schools are already buying and what they would be willing to purchase from a local source. • Many other critical logistical factors that must be considered before purchasing locally • Some schools already have these fruits & veggies in their school garden • Price and cost factor • Processing required to serve the produce? • Conclusion: many of the school directors are willing to purchase Washington produce, but they are not prioritizing purchasing locally grown produce • There are many other factors (ex. price, preparation) that must be factored into their decision.
Question 17: N=69
Question 23: How much did you spend on farm produce? Only 16 respondents answered with a dollar amount, $0.00 to $45,000.00 Many did not respond, others did not know what their district spend on farm produce. The average amount spent was $6,950.00, but…
Question24: Would you purchase Washington grown products directly from farmers/producers again? All 22 of the respondents said that they would purchase Washington grown products directly from farmers/producers again Lack of negative responses is promising
Question 30: Are you interested in working with local farmers in the off season to plan ahead for the farms to plant what you need? 49/63 were interested 14/63 not interested Missing 19 respondents General interest in working with farmers
Question 38 : Indicate interest in events or information Only interest was reported, no negative options
Question 39: Interest in connecting school programs to food service
Potential Associations • The likelihood of a district’s capacity to process fresh produce increases with % of students participating in FRPL programs • The likelihood of considering quality consistency to be a barrier to sourcing food locally increases with district size • The likelihood of considering large volume requirements to be a barrier to sourcing food locally increases with district size • The likelihood of a district’s capacity to process fresh produce decreases with increasing % Caucasian make-up • The likelihood of considering district’s capacity to do minimal food processing to be a barrier to sourcing food locally increases with % Caucasian demographic
Existing Efforts & Current Capacity • Majority of respondents: • Serve Washington-grown foods in school meals and/or purchase foods directly from Washington producers • About half of the respondents: • Highlight such food when it is served, provide education about WA food and agriculture, participate in “Taste Washington Day,” take students to visit a farm or farmer’s market, or plant a school garden.
Existing Efforts & Current Capacity • Majority of respondents: • Can and do operate a central kitchen with the capacity to process fresh fruits and vegetables • Can work with whole produce on a regular or occasional basis • 1/3 of respondents indicated a strong preference for minimal processing
Current Policies • Majority of respondents indicate that no specific food safety requirements are required of the vendors • Of those respondents that had specific food safety requirements most were not sure exactly what they were, and only one mentioned GAP • ~2/3 respondents are able to purchase produce directly from a farmer on short notice • Overwhelming majority of respondents indicate that their district’s wellness policy does not affect food purchasing
Greatest Barriers to Implementing FTS • Top Concerns • consistent availability of the product • seasonality constraints • budget constraints • Least Concerning • volume requirements for buying too small • volume requirements too large • the school district’s ability to do minimal food processing
Recommended Policy Changes Requiring state agencies to purchase local as long as pricing requirements are met Requiring a 5% price preference above lowest bid for state grown products Development of a state-wide food distribution program to procure local foods
Perceived Barriers in Other States • Cost • Extra equipment and prep time requirements • Inadequate supply in the local area • Food safety • Seasonal availability • Transport and storage
Recommendations-Methods • PubMed and Agricola literature review to identify FTS best practices • Practices of other states’ successful programs • WA survey results Comparing these elements revealed opportunities for WA, from which the recommendations emerged
1) Train Staff for FTS Best Practice Train teachers, cooks, and other school staff on FTS Survey Twenty respondents are interested in receiving training on food preparation and safety Nine of these do not currently process fresh produce Recommendation Use state leadership to help train school staff on FTS Focus efforts on the 20 respondents interested in training
2) Assure Adequate Kitchen Facilities Best Practice Assure school kitchens can handle the increase in fresh produce Survey Seventeen school kitchens do not have capacity to process fresh produce, and 20 do not currently do so Twenty-five respondents are interested in renting out space Central kitchens have high capacity to process fresh produce Recommendation Assist in kitchen updating, focus on the 17 kitchens lacking capacity Recommend the use of central kitchens as appropriate Connect companies with the 25 respondents interested in renting
3) Recruit Farms that Supply the Most-Demanded Produce Best Practice Recruit farms that grow the produce that schools demand most Survey Most-demanded produce includes apples, pears, potatoes, grapes The majority of respondents are interested in working with farmers during off-seasons to plan for the future Recommendation Use “matchmaking” tools, directories, and other networks to identify farms that supply the top-demanded produce, and connect them with schools
4) Incorporate FTS into School Wellness Policies Best Practice Include FTS in school Wellness Policies Survey Fifty-six respondents’ Wellness Policies do not address local purchasing Recommendation Add FTS to WA school Wellness Policies and provide guidance on how to write the FTS section Only implement along with other recommendations, to prevent making an unsupported mandate
5) Befriend Your Farmers Best Practice Promote positive working relationships between schools and multiple farms, to overcome procurement challenges Survey Fifty-seven respondents are interested in receiving guidance on product availability, and it is the top-indicated barrier Many of these 57 respondents are also among the 47 that do not currently purchase locally Recommendation Encourage school sourcing from multiple farms or farm co-ops rather than a single supplier
6) Regularly Evaluate FTS Best Practice • Observe and improve inefficiencies; prevent rather than react Survey • Apparent low awareness of FTS outcomes: Forty-six respondents did not answer question on how meal participation changed • Most-indicated barriers are the consistent availability of product, seasonality constraints, finding local growers, and others Recommendation • Utilize state leadership to evaluate FTS programs quarterly • Focus evaluation on the most-indicated barriers—likely points where early problems will occur
7) Utilize State Leadership Best Practice Establish supportive partnerships with state entities such as Depts. of Education, Depts. of Agriculture, universities, and others. Survey Support from state entities can help: Overcome the most-indicated barriers: consistent availability of product, seasonality constraints, finding local growers, and others Provide guidance that respondents most wish to receive: product availability, seasonal recipes and menus, funding issues, and others Recommendation Link schools with WSDA, OSPI, Washington DOH, UW, etc. Necessary for Training and Evaluation recommendations
8) Provide Collaborative Education Best Practice Provide multisensory activities that engage all types of learners Survey Least-initiated activities: harvest/market events, inviting farmers to school, taking students to visit farms/market,highlighting WA-grown foods when served, and school gardens Activities that schools are most interested in: Culinary arts/horticulture programs, nutrition education, and school gardens Recommendation Implement activities that are both the least-initiated and received most interest Integrate into Training